


8/28 – 9/1 Red Rock Update
Tracking the Secular Bull Market to 2036
Howdy, Bull-Riders:
At last week's Jackson Hole Fed conference. Chairman Powell said he expected this morning's core July Personal Consumption Expenditures Index– the Fed’s favorite inflation measure – to be +4.3% year-over-year. Wall Street was on board:

Read month-over-month (year-over-year)
Yesterday we learned that the core number was up 0.8% from June, faster than the 0.6% in June over May. It was up 4.2% year-over-year, a tenth of a percent less than Powell and Wall Street expected. That was a fraction more than June's +4.1%.
Headline inflation rose 0.2% month-over-month and the expected 3.3% year-over-year, an uptick from June's 3.0% year-over-year. But Wall Street saw what they wanted to see. Paul Ashworth, an economist at Oxford Economics, wrote: “Despite the apparent strength of real demand, inflationary pressures continued to ease.”
Really? PCE inflation looks pretty sticky to me.

It's true that the annualized rate of core PCE inflation over the last three months fell to 2.8%, the lowest in 2 ½ years. It's also true that, as usual, there were some categories that were unusually strong. There was a 7% monthly increase in portfolio management prices, which tend to follow the stock market that was up in July. Consumer spending on some large one-offs like “Barbenheimer,” Taylor Swift's “The Eras” tour, and Beyoncé's “Renaissance” tour, added about $8.5 billion to US growth in the current quarter, according to Morgan Stanley, or more than a third of the growth in consumption the firm projects for the September quarter.

Take that, Jay Powell!
It's always easy to cherry-pick the outliers and say: “If it hadn't been for X, Y, and Z, the result would have been different!” But Powell knows that game, so I continue to think it's “Not Much Higher, But For Much Longer” in Fedville. Unwinding the tours, plus the expiration of the student loan moratorium, creates about 1.4% downside to Personal Consumption Expenditures in the December quarter. And US rents are 1.2% lower than a year ago, the biggest year-over-year decline since December 2020.
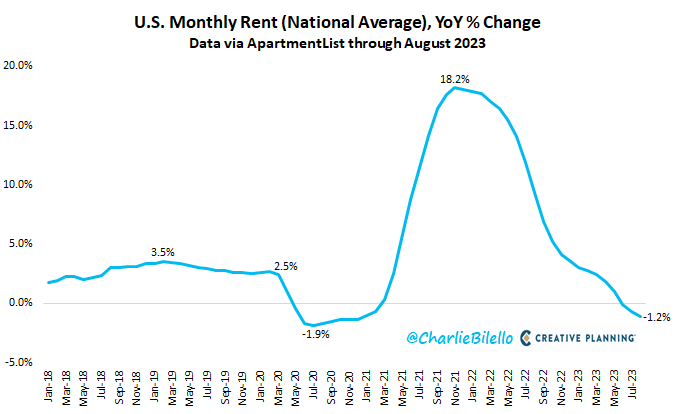
h/t @charliebilello
Yesterday, Atlanta Fed President Raphael Bostic said: “If not for stubborn (and lagging) housing services prices, the core CPI would be running at 2.6% on a year-over-year basis. Given the lagging nature of rental prices...underlying inflation may well be close to our target already."

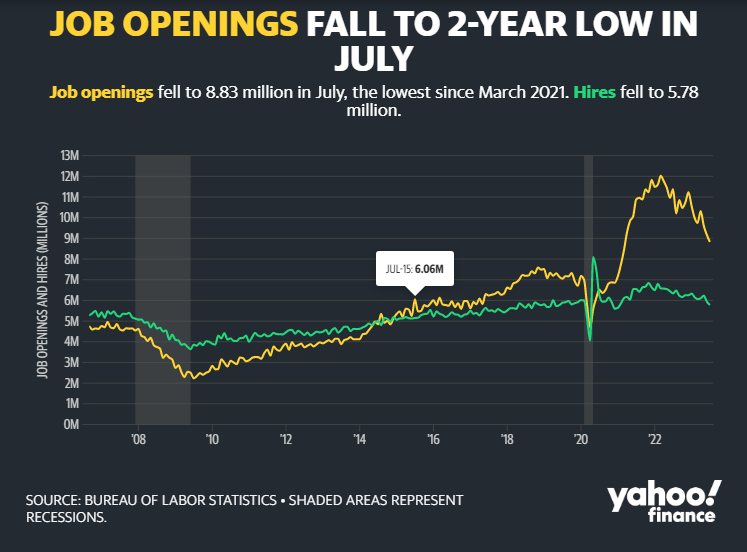
Powell probably will pause, but he'll wait until he sees actual 2% inflation prints before he cuts. July job openings were weak:
This morning we got August payroll growth of +170,000, as expected. Payroll growth for June was revised down by 80,000 (!), from +185,000 to +105,000, and the change for July was revised down by 30,000, from +187,000 to +157,000. With these revisions, employment in June and July combined was a whopping 110,000 lower than previously reported.
On September 13 we get the Consumer Price Index, the last data point before the Fed's next meeting announcement on September 20. If it's “Not Much Higher, But For Much Longer,” stocks of companies that execute well will be the only winners.
Speaking of which...
A few years ago I wrote about the Barbell Portfolio as the best way to manage your wealth. The bulk of your assets are invested in relatively safe, higher-yielding investments like utilities, insurance companies, REITs, and Dividend Aristocrats like Hershey. The rest goes into speculative, home-run investments – large and small technology, biotech, bitcoin, and the like.
There's nothing in between – no index funds, no blue-chip mutual funds, no junk bond funds, no diversified funds…nothing. You know the risk in the safe end of your portfolio is very low. You know the risk in the other end of your portfolio is very high. You control your overall risk by moving a little money from one end of the barbell to the other, because when you don’t own anything in the middle, it only takes a small shift between the two ends of the barbell to make a big difference in your overall risk.
This strategy matches the real-world “fat tail” distribution of stock returns. If you want to read more about it, the report is on Gumroad (CLICK HERE) at a suggested price of $47, but you can pay what you want, even $0. I don't want to turn Boomberg into an income newsletter, but I thought from time to time I might draw your attention to an interesting opportunity for the conservative end of your Barbell. I am NOT making a formal recommendation and I'm not planning to follow these.
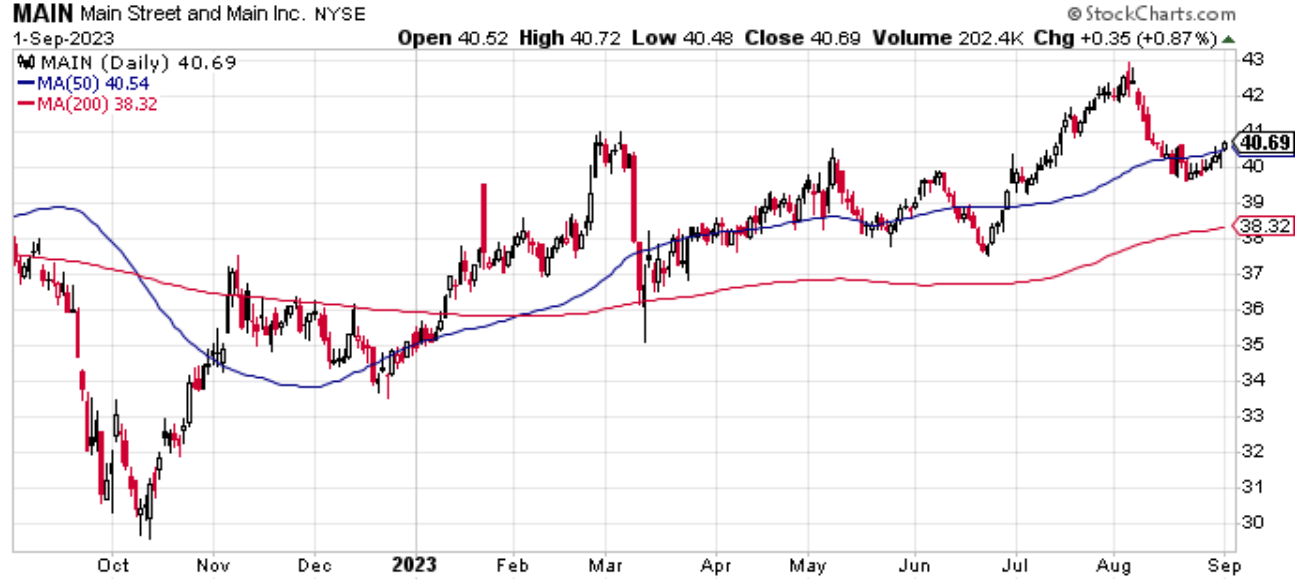
Look At Main Street Capital (MAIN)
Main Street Capital is a Houston-based business development company (BDC) founded in 2007, right before the Great Financial Crisis. They provide equity capital to lower middle market private companies for recapitalizations, management buyouts, and family estate planning. They typically invest $2 million to $75 million in companies with annual revenues between $10 million and $150 million for 5% to 50% of the company.
They also provide debt capital to middle market companies for acquisitions, management buyouts, and refinancing. They typically loan $5 million to $50 million to companies with $1 million to $20 million in annual EBITDA. They invest in a wide range of industries, not just energy, and have made 195 investments.
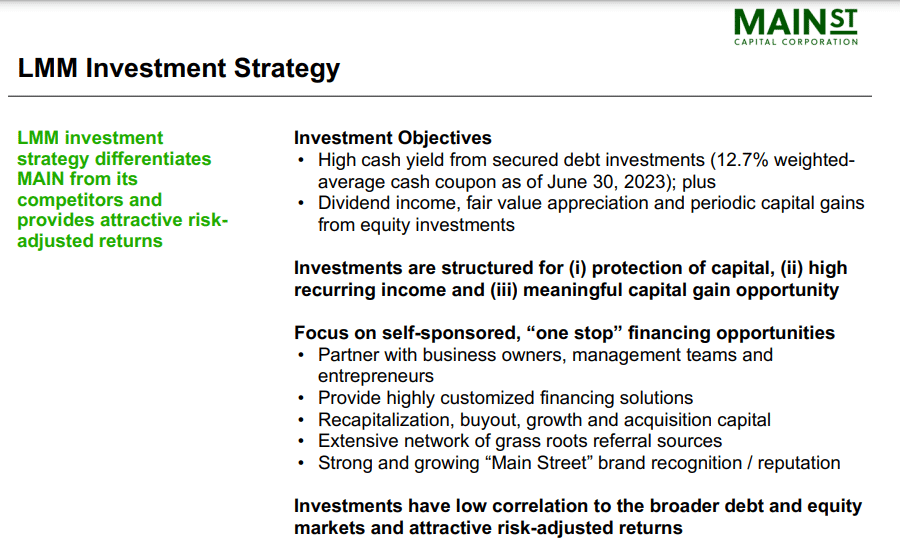
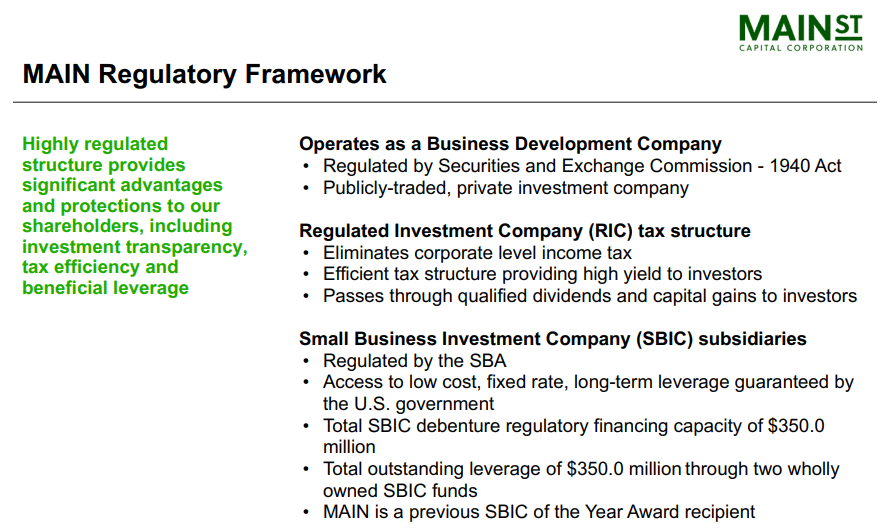
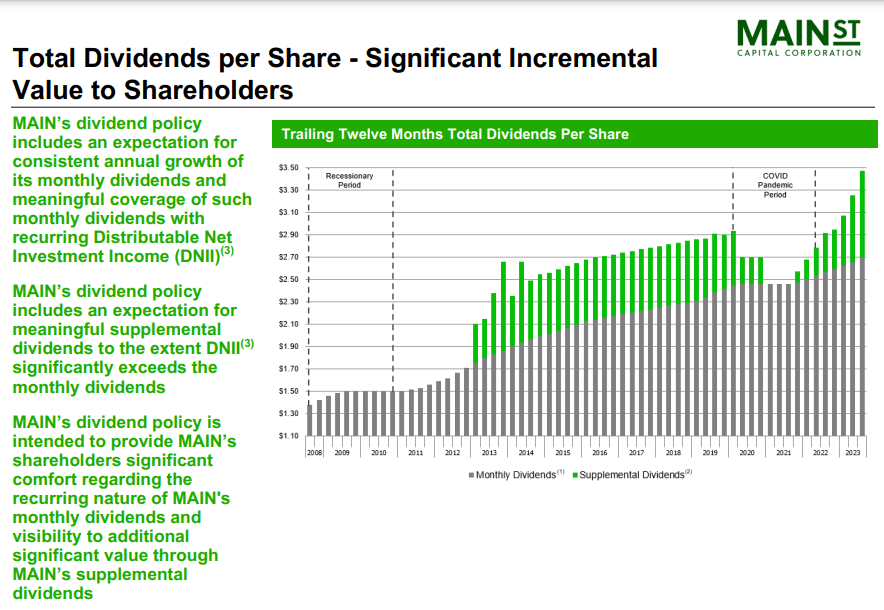
Like all BDCs, they are able to use government money to leverage their returns and must pay out at least 85% of their annual earnings as dividends – thus the 7% yield. The key to investing in BDCs (or REITs) is to find a management team that can steadily grow the dividend and, hopefully, never cut it. People often get sucked in by high double-digit yields right before management has to slash the dividend, tanking the stock.
MAIN pays a monthly dividend and has never decreased it. Over the last 16 years they have increased the monthly dividend 114% from 33¢ per share to 70.5¢ per share.
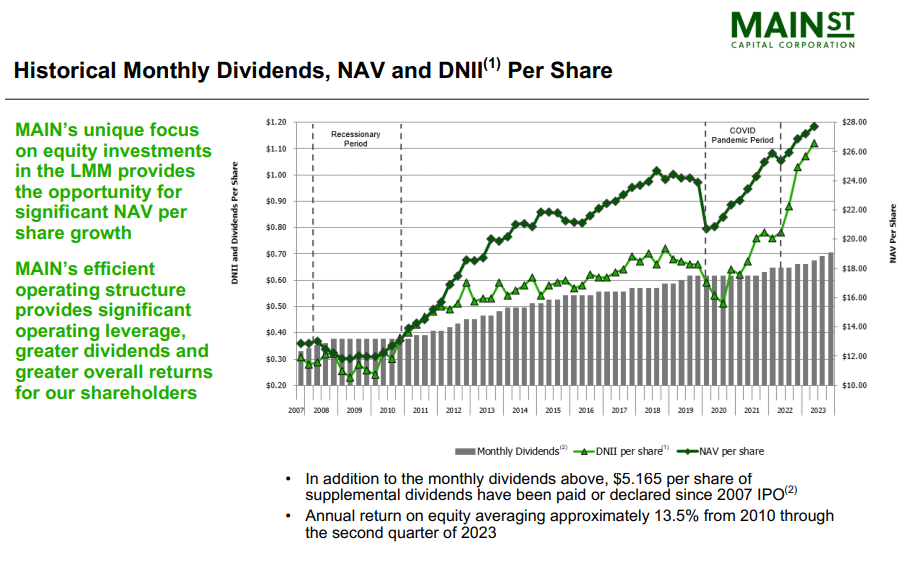
Plus, they paid supplemental dividends of 77.5¢ per share during the last twelve months.
Management owns 3.5 million shares or over $140 million of the stock. If you are interested, check out their June quarter results (SLIDES HERE and TRANSCRIPT HERE). Paid subscribers, let me know in the Comments if you want to see more of these conservative ideas.
Market Outlook
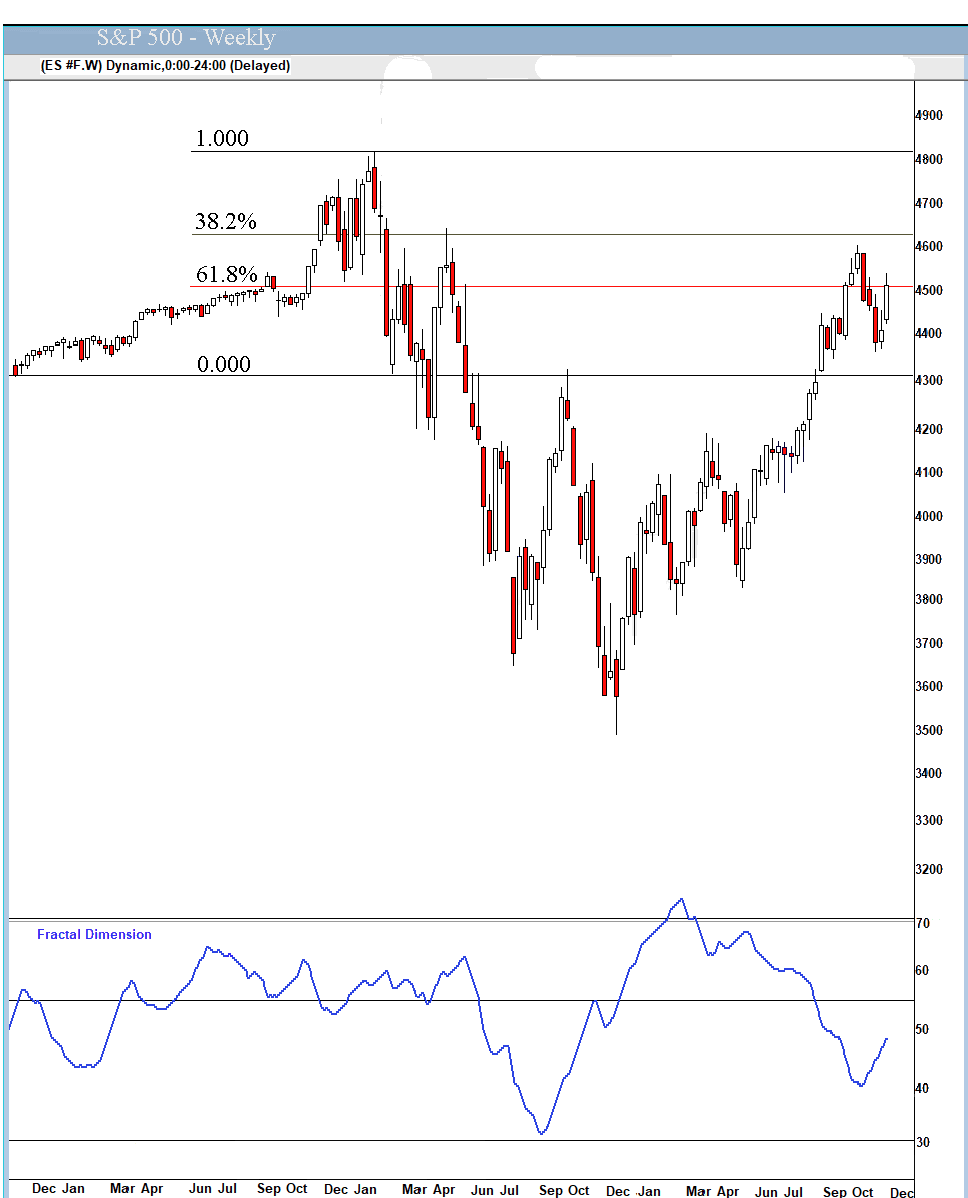
The S&P 500 added 3.0% since last Thursday as investors liked economic strength more than they feared inflation and the Fed. But a down August – the worst month since February – ended a five-month winning streak. Still, the Index is up 17.4% year-to-date. The Nasdaq Composite gained 4.2% as investors sought revenue and earnings growth. It also ended a five-month winning streak (with the worst month since last November) but is up 34.1% for the year. The small-cap Russell 2000 rose 2.9% and is up 7.9% in 2023.
With most hedge funds lagging the S&P, not to mention Nasdaq, what do you think they will do when they get back from the beach?
The fractal dimension counted this week's rally as more consolidation, enough to almost hit the 55 level. There is going to be plenty of energy to power a fourth-quarter rally.
How big could that be? The “This is just like...” analogies usually blow up right after someone notices them. This chart comparing 2023 to 1999 probably is wrong, too, mostly because AI in 2023 is not yet having the same impact as the Internet in 1999. It will, in five years or so - and we’ll own the winners.
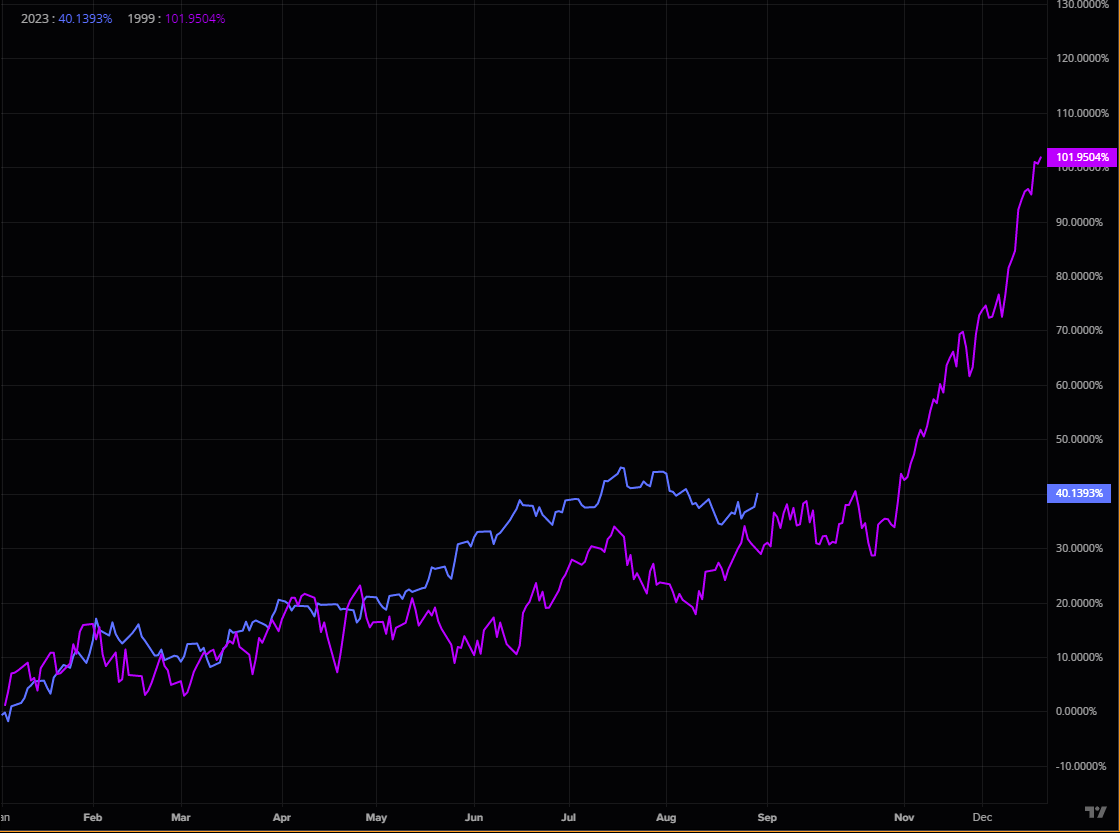
h/t @TheMarketEar
Economy
June quarter real GDP growth was revised down from the first estimate of +2.4% to +2.1%. The main revision was businesses liquidating more inventories than first thought, which is good news for growth going forward. Consumer spending, which accounts for about 70% of the US economy, rose at a 1.7% annual pace in the June quarter, down from 4.2% in the first three months of 2023.
For the September quarter, this morning's Atlanta Fed's GDPNow model estimate is at +5.6%, about triple the Blue Chip economists' estimate. It looks like a big surprise is coming when the first estimate is announced on October 26.

Golden Age Portfolio Update
This was another good week for the portfolio as it gained 2.3%. We're now up 41.9% with much more to come. Let's dig in...