


7/8 – 7/12 Red Rock Update
Building Wealth in the Secular Bull Market to 2036
Stocks peak about every 36 years, most recently in 1929, 1965, and 2000. This 36-year cycle can be traced all the way back to the earliest eras in recorded human history, back to Pythagoras and Plato and the Axial Age around 600BC. After each peak comes a period of decline (punctuated by bear market rallies) that typically lasts 16 years or so. Then, with the excesses of the prior bull period wrung out and investors most depressed, the next 20-year run to the next market top can begin. We're in that Golden Age now – take advantage of it!
Howdy, Bull-Riders:
There is a new development-stage biotech recommendation below the paywall. Although this can return $20 for every $1 invested, please remember that these stocks are inherently risky. Clinical trials may fail, the FDA may turn the drug down, the company might run out of money...the risks as well as the rewards are high. Position sizing and risk control are everything.
Thursday morning's June Consumer Price Index report showed headline inflation actually fell 0.1% from May and increased only 3.9% from last year. Both numbers were below May (0.0% MoM and 3.3% YoY) and below the consensus estimates for +0.0% MoM and +3.1% YoY. This is the first time since May 2020 that the monthly headline CPI came in negative. It's also the slowest annual gain in prices since March 2021.
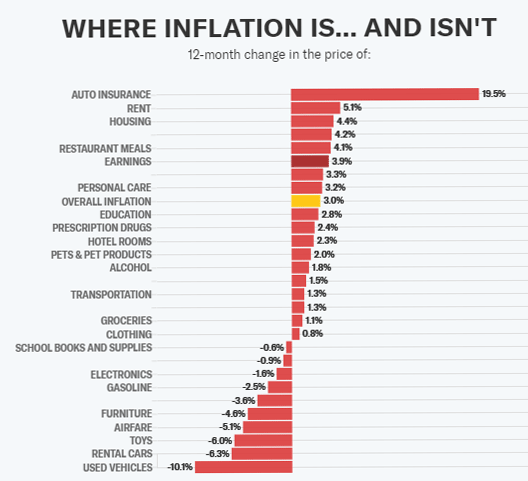
h/t Yahoo Finance
The core CPI, which strips out the more volatile costs of food and gas, climbed 0.1% MoM and 3.3% YoY. Again, both numbers were below May's 0.2% MoM and 3.4% YoY, and below the consensus estimates for +0.2% MoM and +3.4% YoY. It was the smallest month-over-month increase in core prices since August 2021. The three-month annualized core CPI dropped to 2.1% in June, its lowest level since Covid.
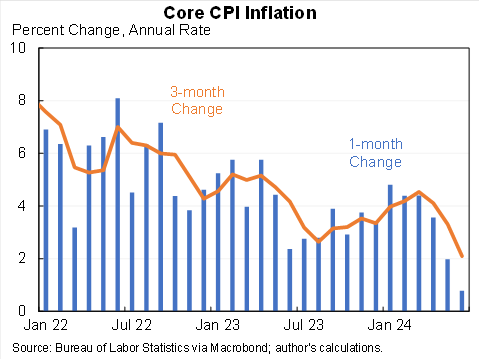
h/t @jasonfurman
The troublesome shelter index rose 5.2% YoY, the same as May, and 0.2% MoM, a slowdown from May's 0.4%. The indices for rent and owners' equivalent rent each rose 0.3% MoM, the smallest increases in these indices since August 2021. Shelter is 34% of the core CPI and 18% of the core Personal Consumption Expenditures Index (PCE). As we know, aside from the core PCE, the Fed is most focused on core Services CPI inflation ex-shelter. That had a very unusual month-over-month negative print in May and did it again Thursday – minus 0.1% was the lowest since August 2021.
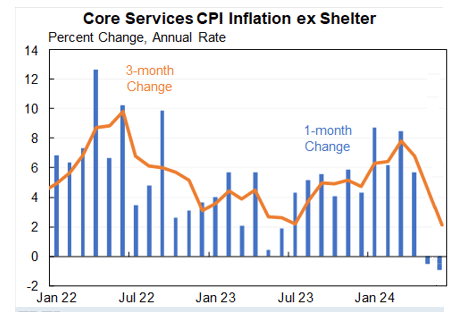
h/t @BobEUnlimited
Inflation is over. The CME FedWatch tool showed markets were pricing in an 89% chance that the Fed begins to cut rates at its September meeting, up from 75% on Wednesday. I doubt the decline in the consumer price index between May and June will repeat, but it does strengthen the case for the Federal Reserve to begin cutting interest rates in September, especially since the labor market has softened.
Some market watchers think the Fed could even cut in July, but I doubt it. It would raise questions of “What do they know about the economy that we don't know?” Plus, the Fed still needs additional evidence of slowing price pressures to be absolutely certain of the inflation path getting to their 2% target.
Of course, there's not a chance the Fed will raise the Fed funds rate. June was the first month since October 2020 when not a single global central bank raised rates. If the Fed raised, the Dollar Wrecking Ball would cripple many other economies.
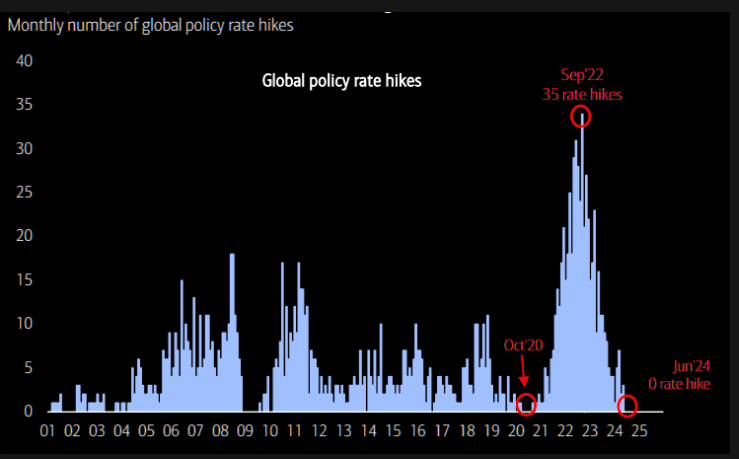
h/t The Market Ear
The only question is when the Fed will cut rates, not if – so that cut is already discounted by the markets. On Thursday, the small-cap Russell 2000 was up 3.57% while the tech-heavy Nasdaq 100 was down 2.24%. This is what happens when markets broaden out, and broadening markets means more upside to come. Even biotechs caught a bid.
In other news, June payrolls supposedly increased by 206,000, above the 190,000 consensus estimate. I say “supposedly” because the May number was revised down just a smidge from the 272,000 initially reported to 218,000.
The first and second revisions have been pretty dramatic. Something is seriously wrong with their models.
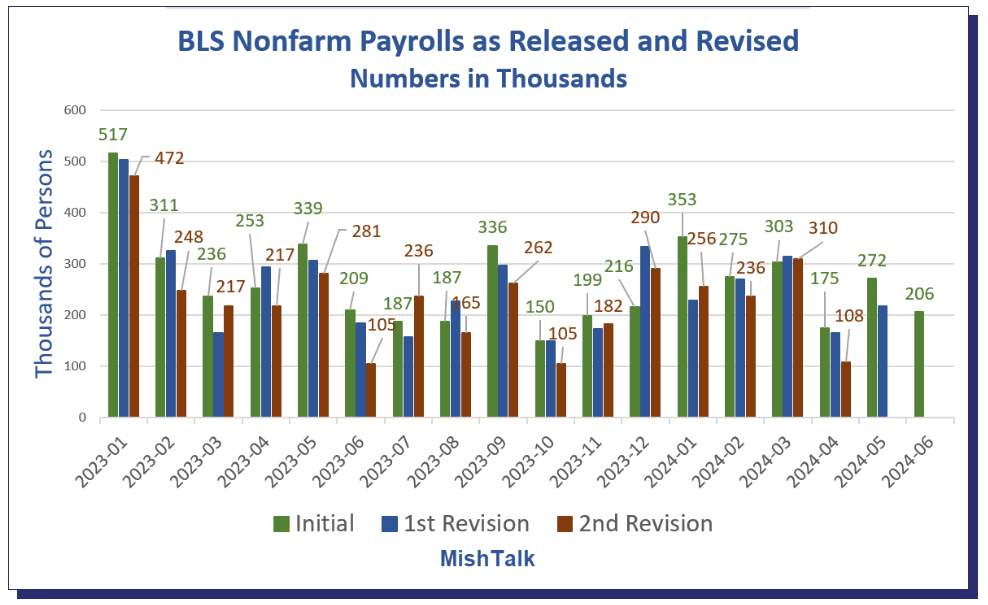
h/t Mish
All of the job gains over the last year have come from typically low-earning, part-time roles. The number of full-time jobs peaked at 134.8 million in June 2023 and is now down to 133.2 million - a loss of 1.6 million full-time jobs over the last year. The unemployment rate rose from 4.0% in May to 4.1% in June, the highest reading in almost three years. It has jumped from a low of 3.4% to 4.1%, while continuing jobless claims have reached 1.86 million - the highest level since November 2021.
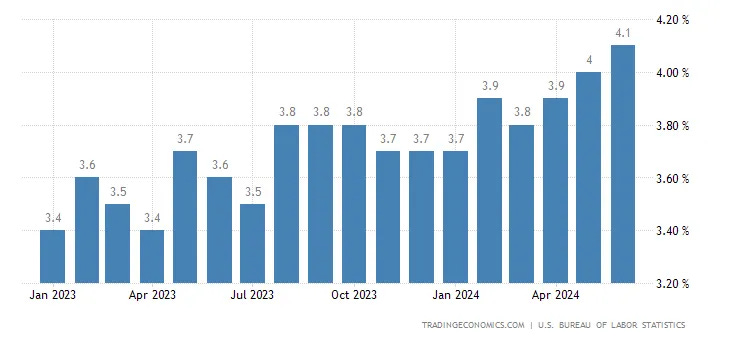
h/t @OphirGottlieb
A recession is now inevitable and we may already be in one. Job openings have been rapidly declining, and such sharp drops have only occurred three times since 2000: The dot-com bubble, the Great Financial Crisis, and the pandemic. All three ended with a sharp economic downturn. The bad part this time is that the consumer has run out of excess savings and is holding record levels of credit card debt.
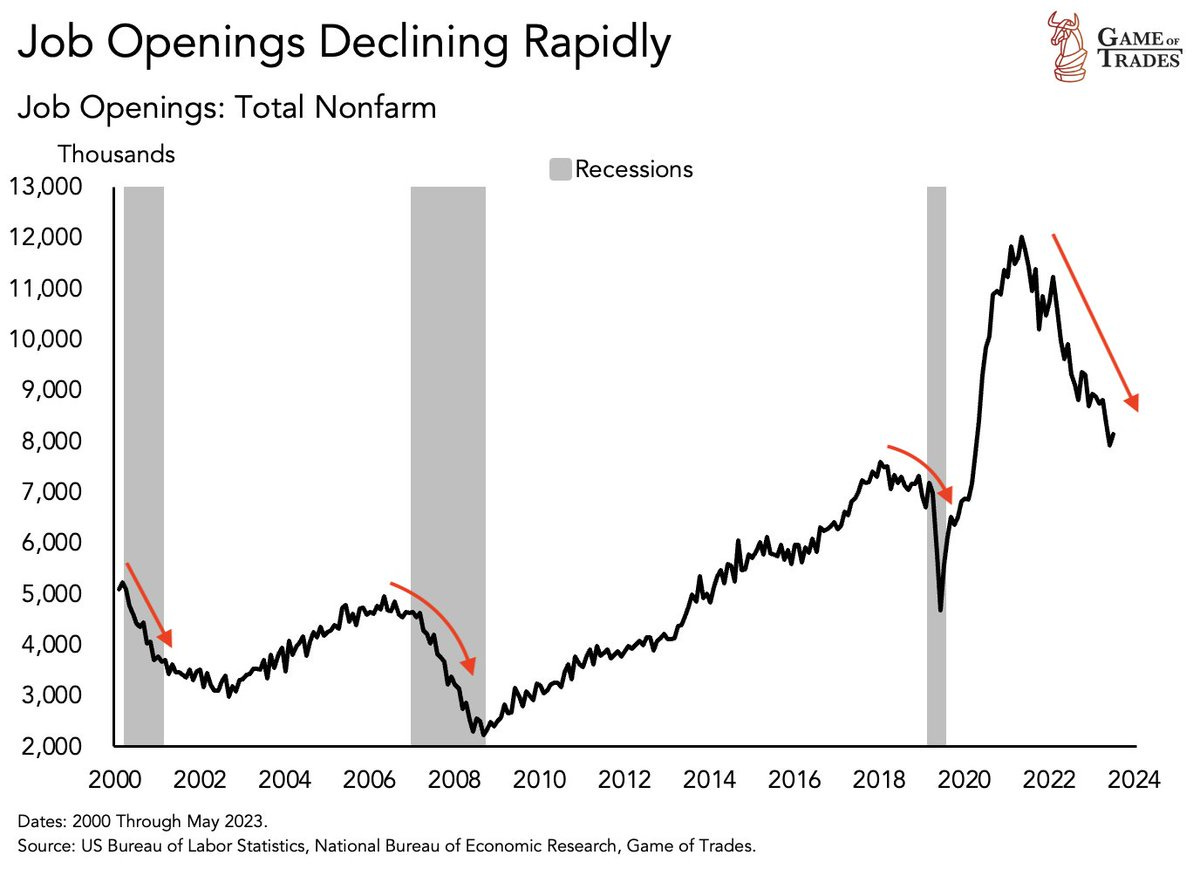
h/t @GameofTrades_
The unemployment rate has moved above its 36-month moving average. Such a development has happened 10 prior times since 1952. Every single time, it ended in a recession.
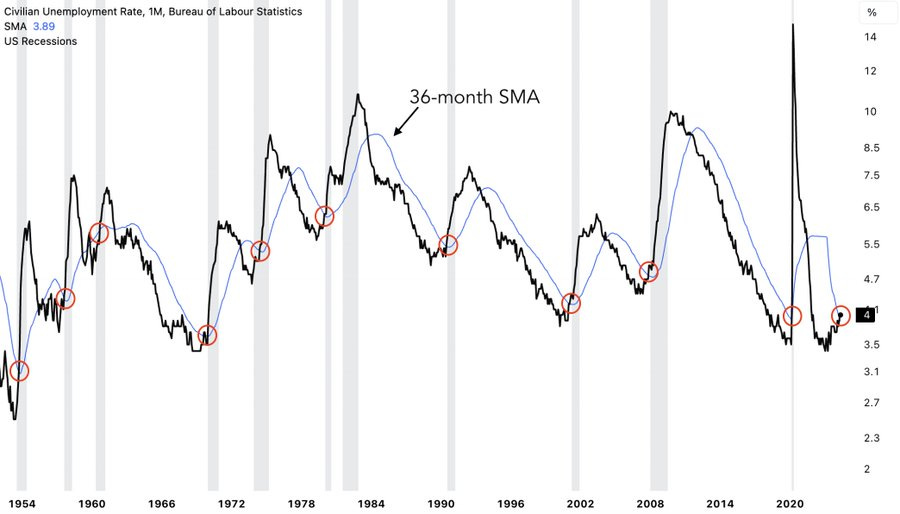
h/t @GameofTrades_
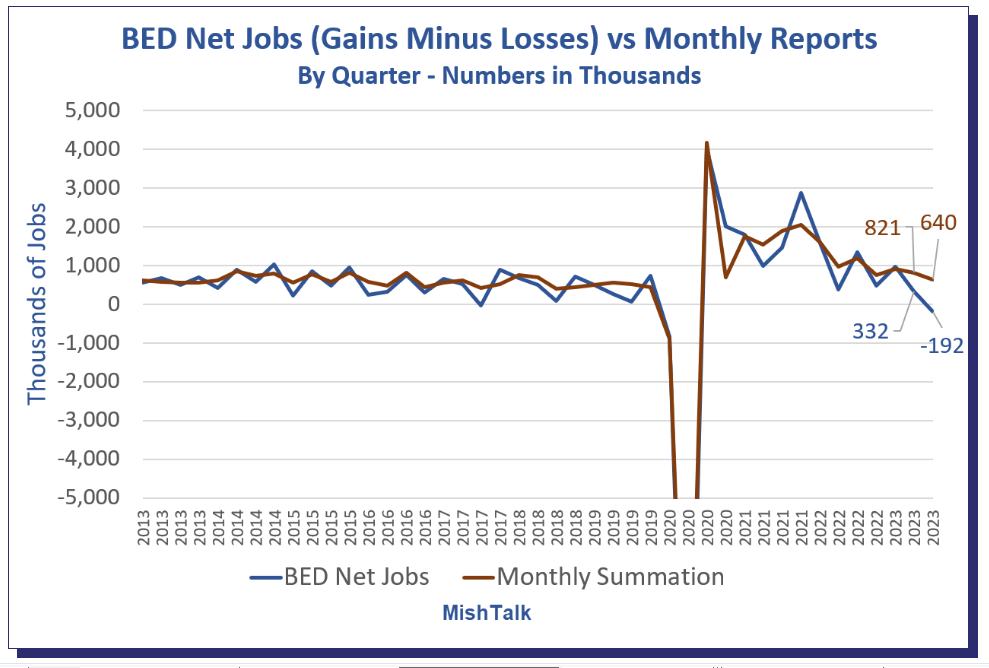
At the same time, the “strong” monthly payroll numbers are being revised down sharply by the more accurate quarterly Business Employment Dynamics (BED) report from the Bureau of Labor Statistics. Mike Shedlock (Mish) said for the September 2023 quarter, the BED report shows gross job gains of 7.559 million and gross job losses of 7.751 million for a net loss of 192,000 jobs. The BLS monthly jobs reports show a gain of 640,000 jobs.
h/t Mish
The BED data is based on 9.1 million establishments while the monthly jobs reports are only based on 670,000 establishments. The monthly reports are timely but inaccurate. In the June 2023 quarter, they overstated payrolls by 489,000 jobs, and in the September quarter by 832,000 jobs, That's a total of 1.321 million phantom jobs. We get the December quarter BED report on July 24.
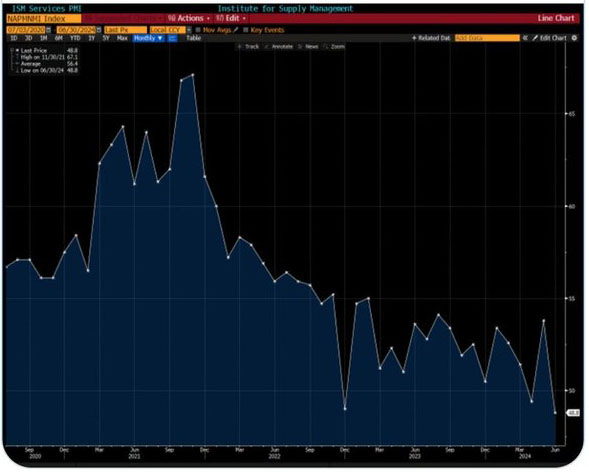
Finally, we just got the lowest ISM Services number since the heart of the pandemic.
h/t @Lisaabramowic
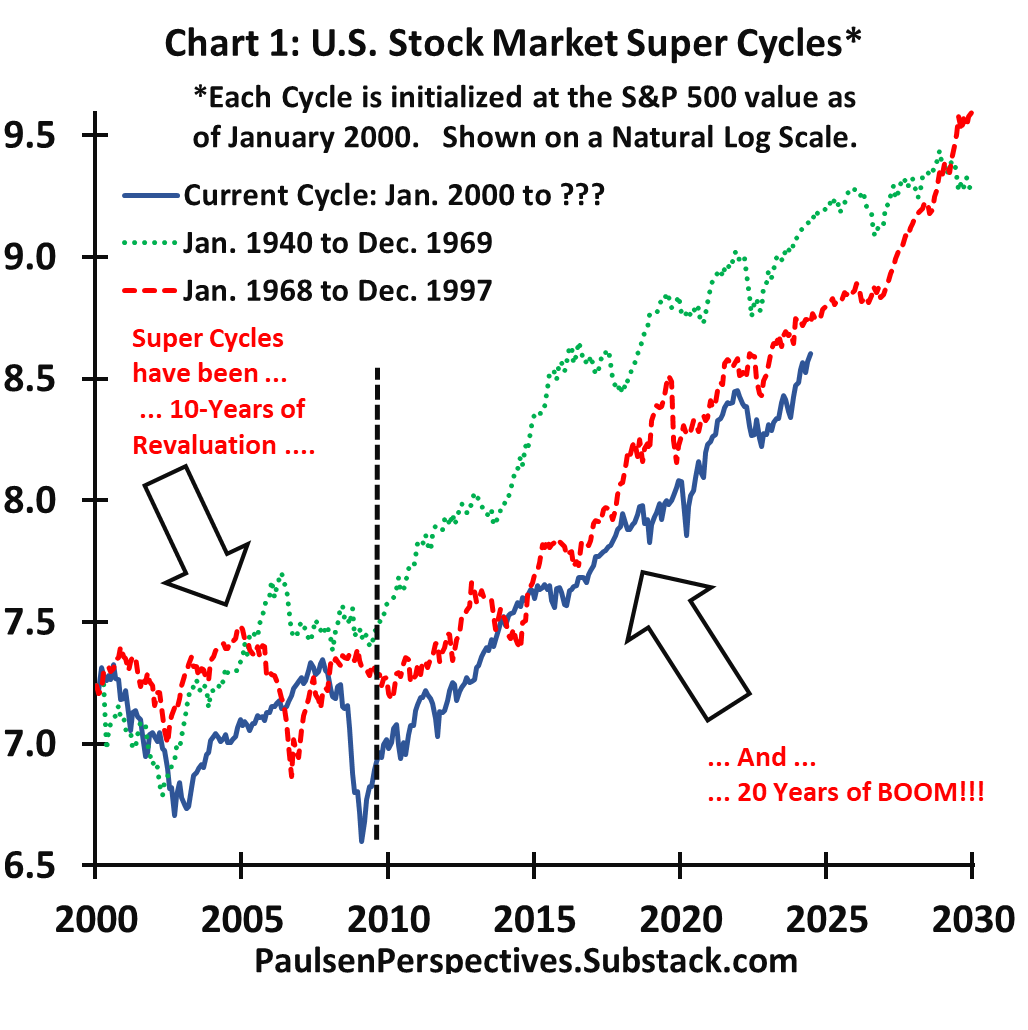
And, Most Important: I often talk about the 36-year stock market cycle, due to peak again in 2036. @jimwpaulsen has noticed a similar pattern and writes: “The US stock market is in its 3rd Super Cycle of the last 100 years. If it continues to mimic the last 2 cycles for the next 6 years, it will deliver 14.7% average annualized price gains. See my full report and sign up for a free trial at

h/t @jimwpaulsen
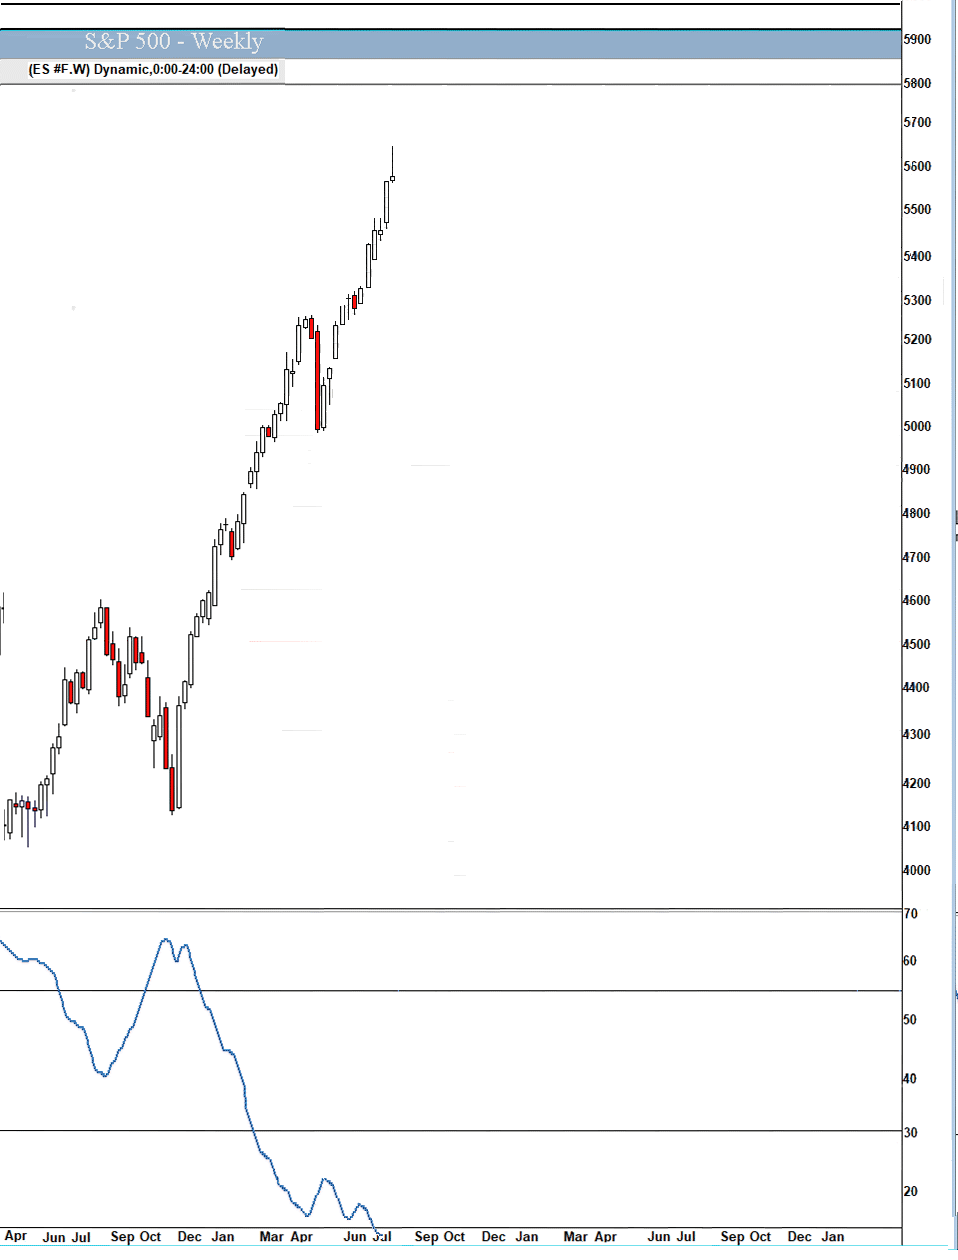
The Bottom Line: I still expect a mild recession and a drop in the S&P 500 back to the 5000 area, but it may not happen until 2025. It will be a buying opportunity for the continued uptrend to 2036 as Artificial Intelligence and the metaverse remake the world's economy.
Market Outlook
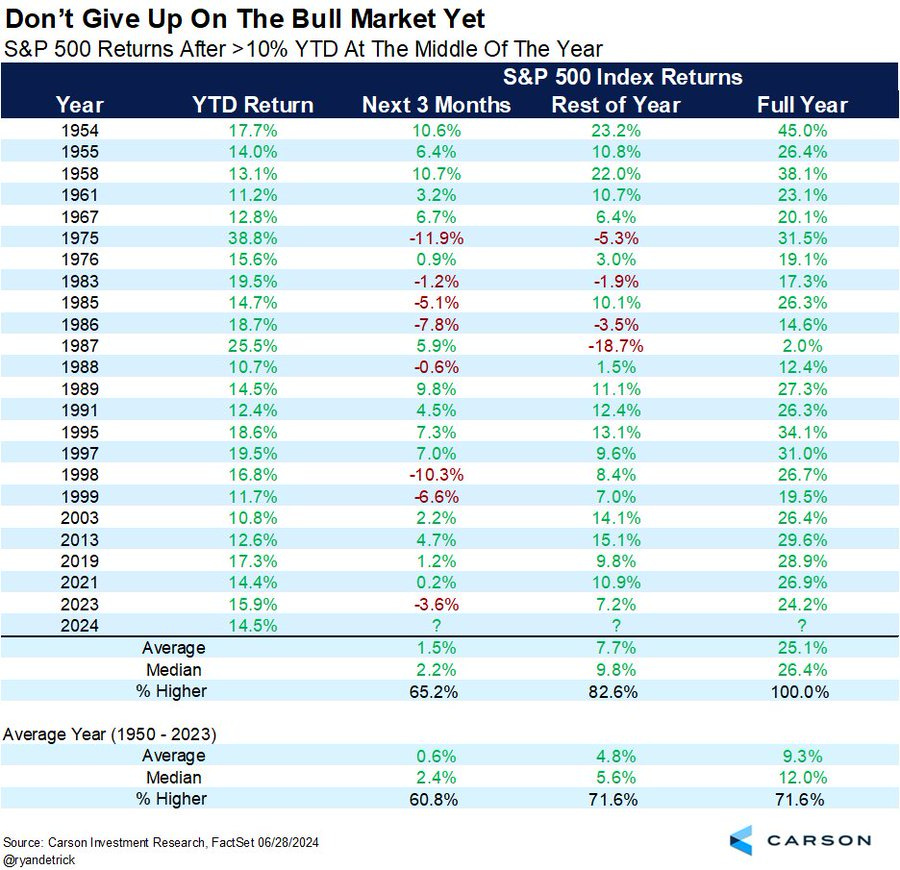
Even after Thursday's drop, the S&P 500 added 0.9% since last Wednesday with seven straight up days to a new all-time high Wednesday over 5600 – its 37th record this year. It hit a new intraday high today before backing off for the weekend. The Index is up 17.1% year-to-date. When the S&P 500 was up double digits at the midpoint of the year, the second half of the year again did better than most years.
h/t @RyanDetrick
The Nasdaq Composite gained 0.5% to a new record close Wednesday and intraday high Thursday. It is up 21.8% for the year. The tech-heavy Nasdaq 100, driven by the Magnificent 7, has been doing the heavy lifting so far this year and it may be just getting started:
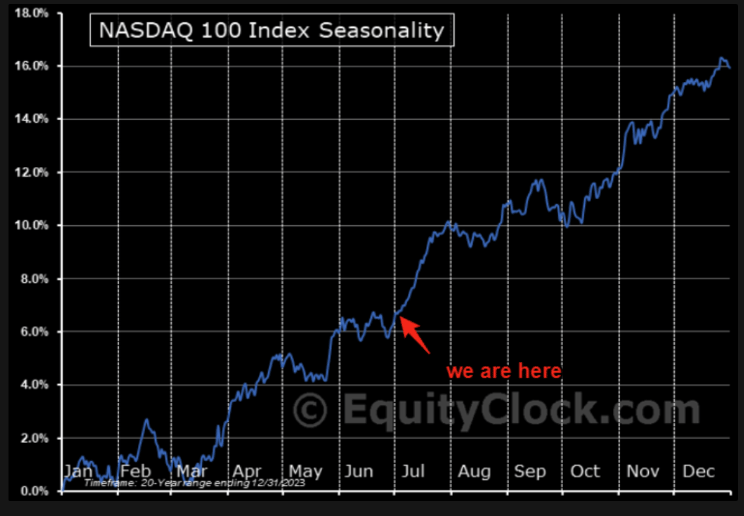
h/t The Market Ear
Backing up the Magnificent 7, BofA pointed out that earnings for the S&P 493 haven't registered year-over-year growth since the fourth quarter of 2022 – and that is about to change. The stealth earnings recession for the vast majority of companies in the S&P 500 is over.
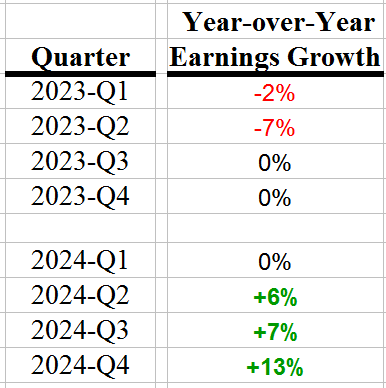
h/t @BankofAmerica
The SPDR S&P Biotech Exchange-Traded Fund (XBI) jumped 7.8% as investors realized interest rate cuts benefit long-term growth stocks the most. It is up 9.7% year-to-date. The small-cap Russell 2000 booked a strong 4.3%, including 3.8% Thursday, and is up 4.8% in 2024 – with much more to come.
Wrong-footed investors have poured a record amount of cash into money-market funds that will cushion any decline:
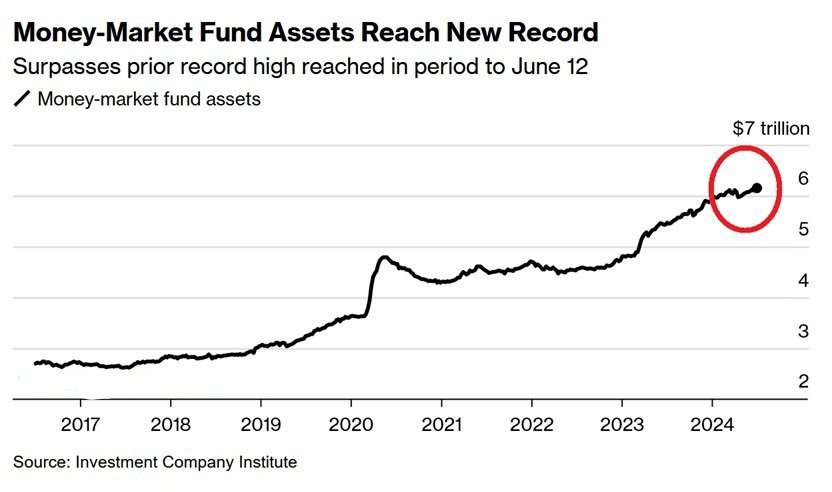
h/t @WinfieldSmart
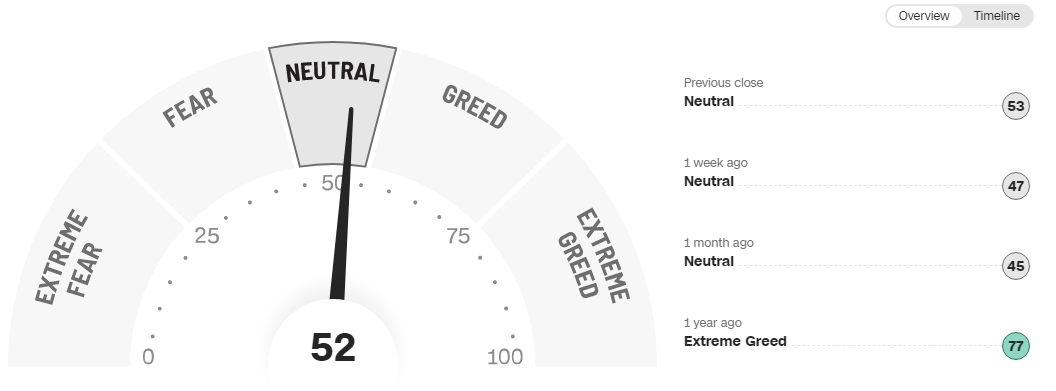
And it's very strange that new daily all-time highs aren't enough to get investors greedy yet. They will – at the wrong time, as usual.
Finally, JPMorgan fired Marko Kolanovic, their macro analyst, for being the last macro bear on Wall Street. Kolanovic called for a recession that hasn’t materialized (I sympathize), largely missed the artificial intelligence boom that has propelled technology stocks for the past 18 months, and is predicting a 24% decline in the S&P by yearend. If you tell clients that markets will fall and they rise instead, your clients hate you, your sales force has trouble writing tickets, and your firm loses face and money.
Morgan Stanley’s Mike Wilson, long one of Wall Street’s most prominent bears, dropped his bet against the S&P 500 in May, leaving Kolanovic and JPMorgan as the outlier. Morgan Stanley sent an internal memo in February announcing that Wilson was leaving his post as chairman of the bank’s Global Investment Committee.
The fractal dimension at least stopped dropping after Thursday's S&P sell-off, but it's going to take many more points or, more likely, many more weeks to get the fractals fully consolidated again.
Economy
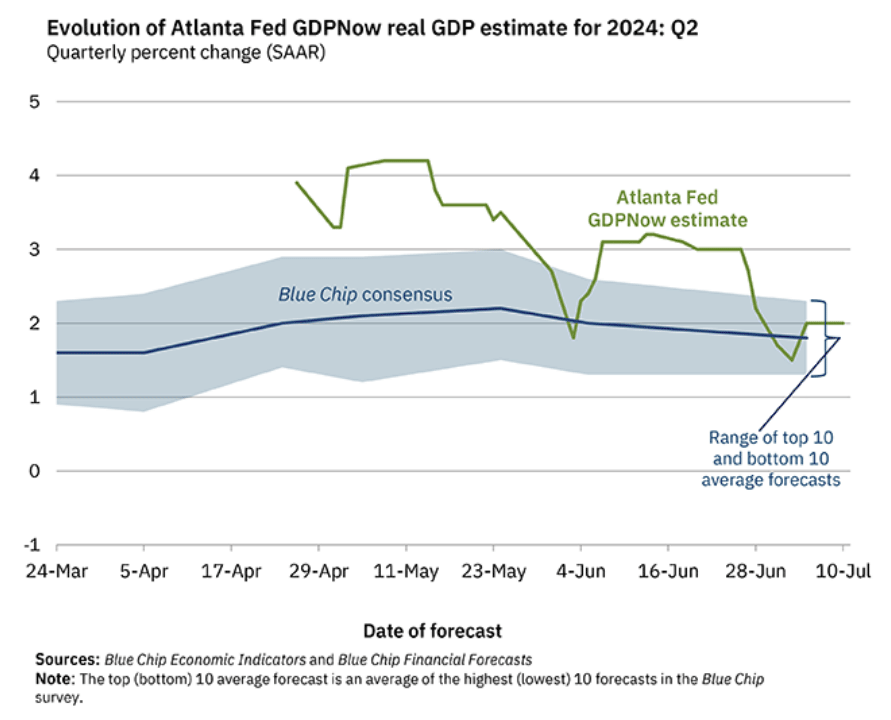
The Atlanta Fed's GDPNow model estimate for June quarter real GDP growth increased back to +2.0% due to big increases in personal consumption expenditures growth and private domestic investment growth. Color me dubious. The first government estimate comes on July 25.
The June payrolls report showed a 1.2% year-over-year decline in Full Time Work. In the past, that shows no false positives in predicting a recession.

h/t @DrJStrategy
Coming Events for Free Subscribers
Our companies start reporting on July 30, followed by the earnings deluge. There are no events next week. The next big ones are the December 2023 quarter Business Employment Dynamics on July 24, the first estimate of June quarter real GDP on July 25, the next Personal Consumption Expenditures Index on July 26, and the next Fed meeting the following week on July 31.
Below The Paywall This Week
* * The new biotech recommendation!
* * Big news on four of our big Tech recommendations
* * Buy this small tech before August 8!
* * Is OPEC+ trying to force a US recession?
* * The one precious metals stock you need to own right now
* * The right way to buy the one cryptocurrency you need to own
Golden Age Portfolio Update
This was a very good week for the portfolio as it added another 1.3%. We're now up a whopping +40.9% with much more to come. It's not too late -JOIN US! Let's dig in...
* * * * * * * * * * * * * * * * * * * * * * * * * * * * * * * * * * * * * * * * * * * * * * * * * * * * * * *
500 years of interest rates, visualized:
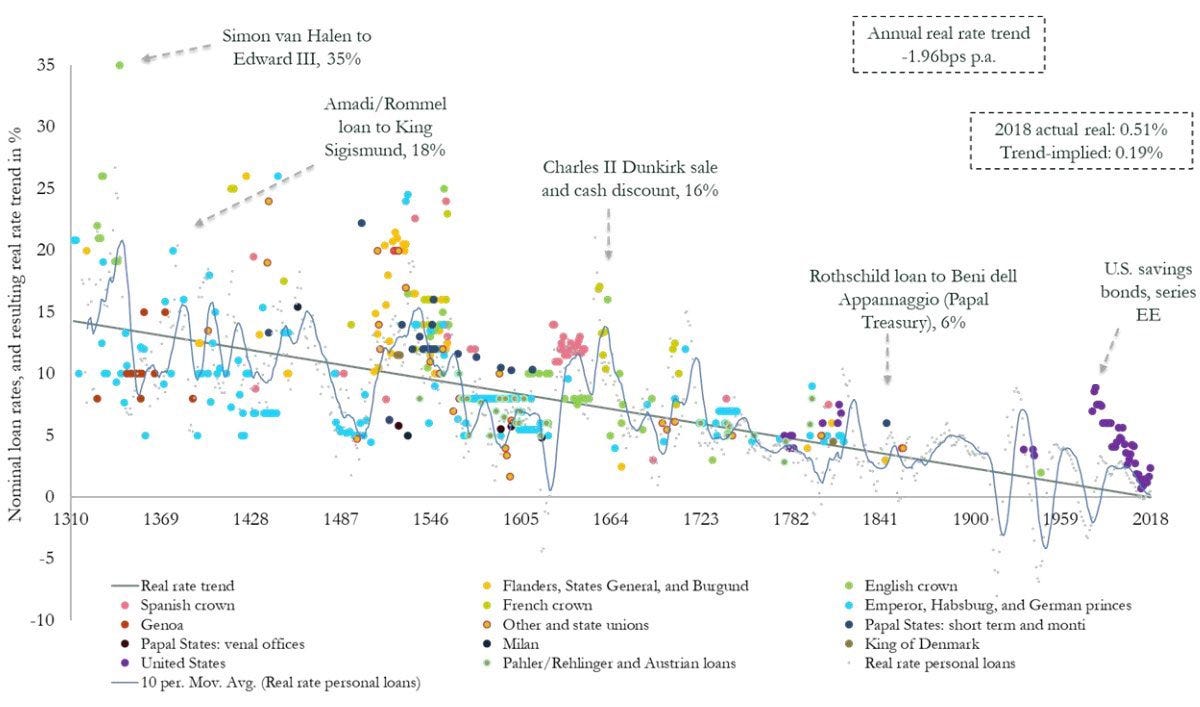
h/t @BrianFeroldi
* * * * * * * * * * * * * * * * * * * * * * * * * * * * * * * * * * * * * * * * * * * * * * * * * * * * * * *
“About every ten years, we have the biggest crisis in 50 years.”
—Paul Volcker, Former Chairman of the Federal Reserve
from Boom and Bust: Financial Cycles and Human Prosperity by Alex J. Pollock, AEI Press, 2010.
* * * * * * * * * * * * * * * * * * * * * * * * * * * * * * * * * * * * * * * * * * * * * * * * * * * * * * *
Your worried about assassinations Editor,
Paid subscriber or not, if you would click the ♥ symbol below it would really help me get the word out.