

4/1 – 4/5 Red Rock Update
4/1 – 4/5 Red Rock Update
Building Wealth in the Secular Bull Market to 2036
Stocks peak about every 36 years, most recently in 1929, 1965, and 2000. This 36 year cycle can be traced all the way back to the earliest eras in recorded human history, back to Pythagoras and Plato and the Axial Age around 600BC. After each peak comes a period of decline (punctuated by bear market rallies) that typically lasts 16 years or so. Then, with the excesses of the prior bull period wrung out and investors most depressed, the next 20-year run to the next market top can begin. We're in that Golden Age now – take advantage of it!
Howdy, Bull-Riders:
Wall Street wants you to focus on how many times the Fed will cut rates this year even though economic data is coming in stronger than they expected. Almost every brokerage firm expects a quarter-point cut at the June 12 Fed meeting, followed by two or three cuts through the end of the year. After all, Fed Chairman Powell has telegraphed rate cuts are coming since his pivot late last year.
I have a two-part different view. First, Powell really is “data-dependent.” so he will wait until he sees at least early signs of weakness before cutting rates. Because:
(A) this is an election year when Presidents of either party benefit from initial data releases showing a strong economy (that are quietly revised lower, later),
(B) government economists mostly use trendline models to estimate those data releases, so they miss inflection points when things change, and
(C) there's a lot of anecdotal evidence that economic activity is weakening,
I still expect the Fed to yet again cause a recession, this time mild and brief.
Second, what the Fed does is not nearly as important as what companies do. From Apple opening the kimono on their AI features at June's Worldwide Developer's Conference, to Enovix shipping batteries from their Fab2 in Malaysia, to ScyNexis announcing the FDA has lifted the clinical hold on ibrexafungerp, to Acreage Holdings completing their merger with Canopy Growth US, company news and execution will drive stock prices much more than whether the Fed cuts three times, two times, one time, or not at all. As usual, Wall Street wants you to focus on the shells while they hide the pea.
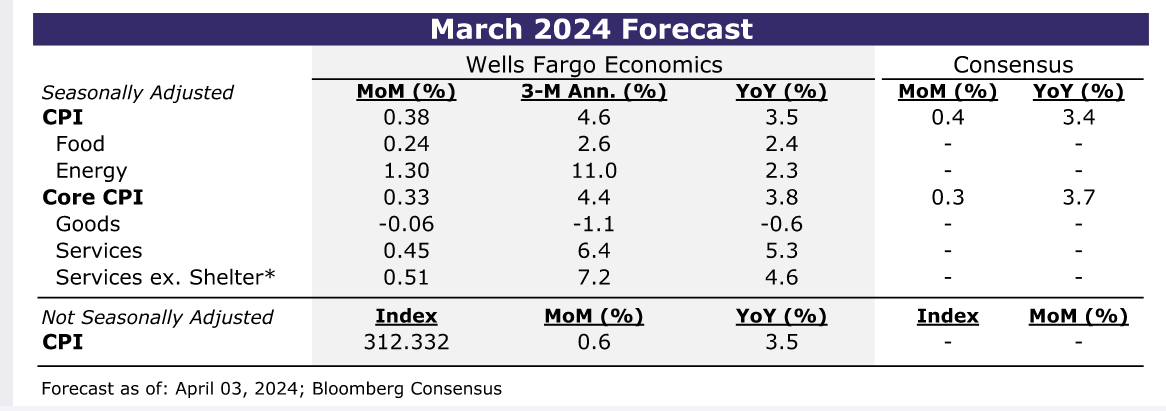
Next Wednesday's Consumer Price Index report will be a key indication of whether the pickup in inflation at the start of 2024 was a function of early-year noise or if inflation's journey back to the Fed's 2% target has been drawn out materially. Wells Fargo economists think the headline CPI likely rose by 0.4% for the second straight month, which would push the year-over-year rate up to a six-month high of 3.5%. They think the core rate, excluding food and energy, rose 0.3% — a bit softer than January and February, but similar to the December quarter average. That would be a sign that underlying progress remains stubbornly slow.
Looking beyond March, inflation probably will move lower this year as the shelter components start to reflect 2023's softness in rents. Further moderation in shelter costs will help drive the year-over-year rate of core CPI down from 3.8% at present to 3.3% by yearend. But headline progress will be more of a grind ahead because a rebound in commodity costs have turned food and energy from tailwinds to headwinds.
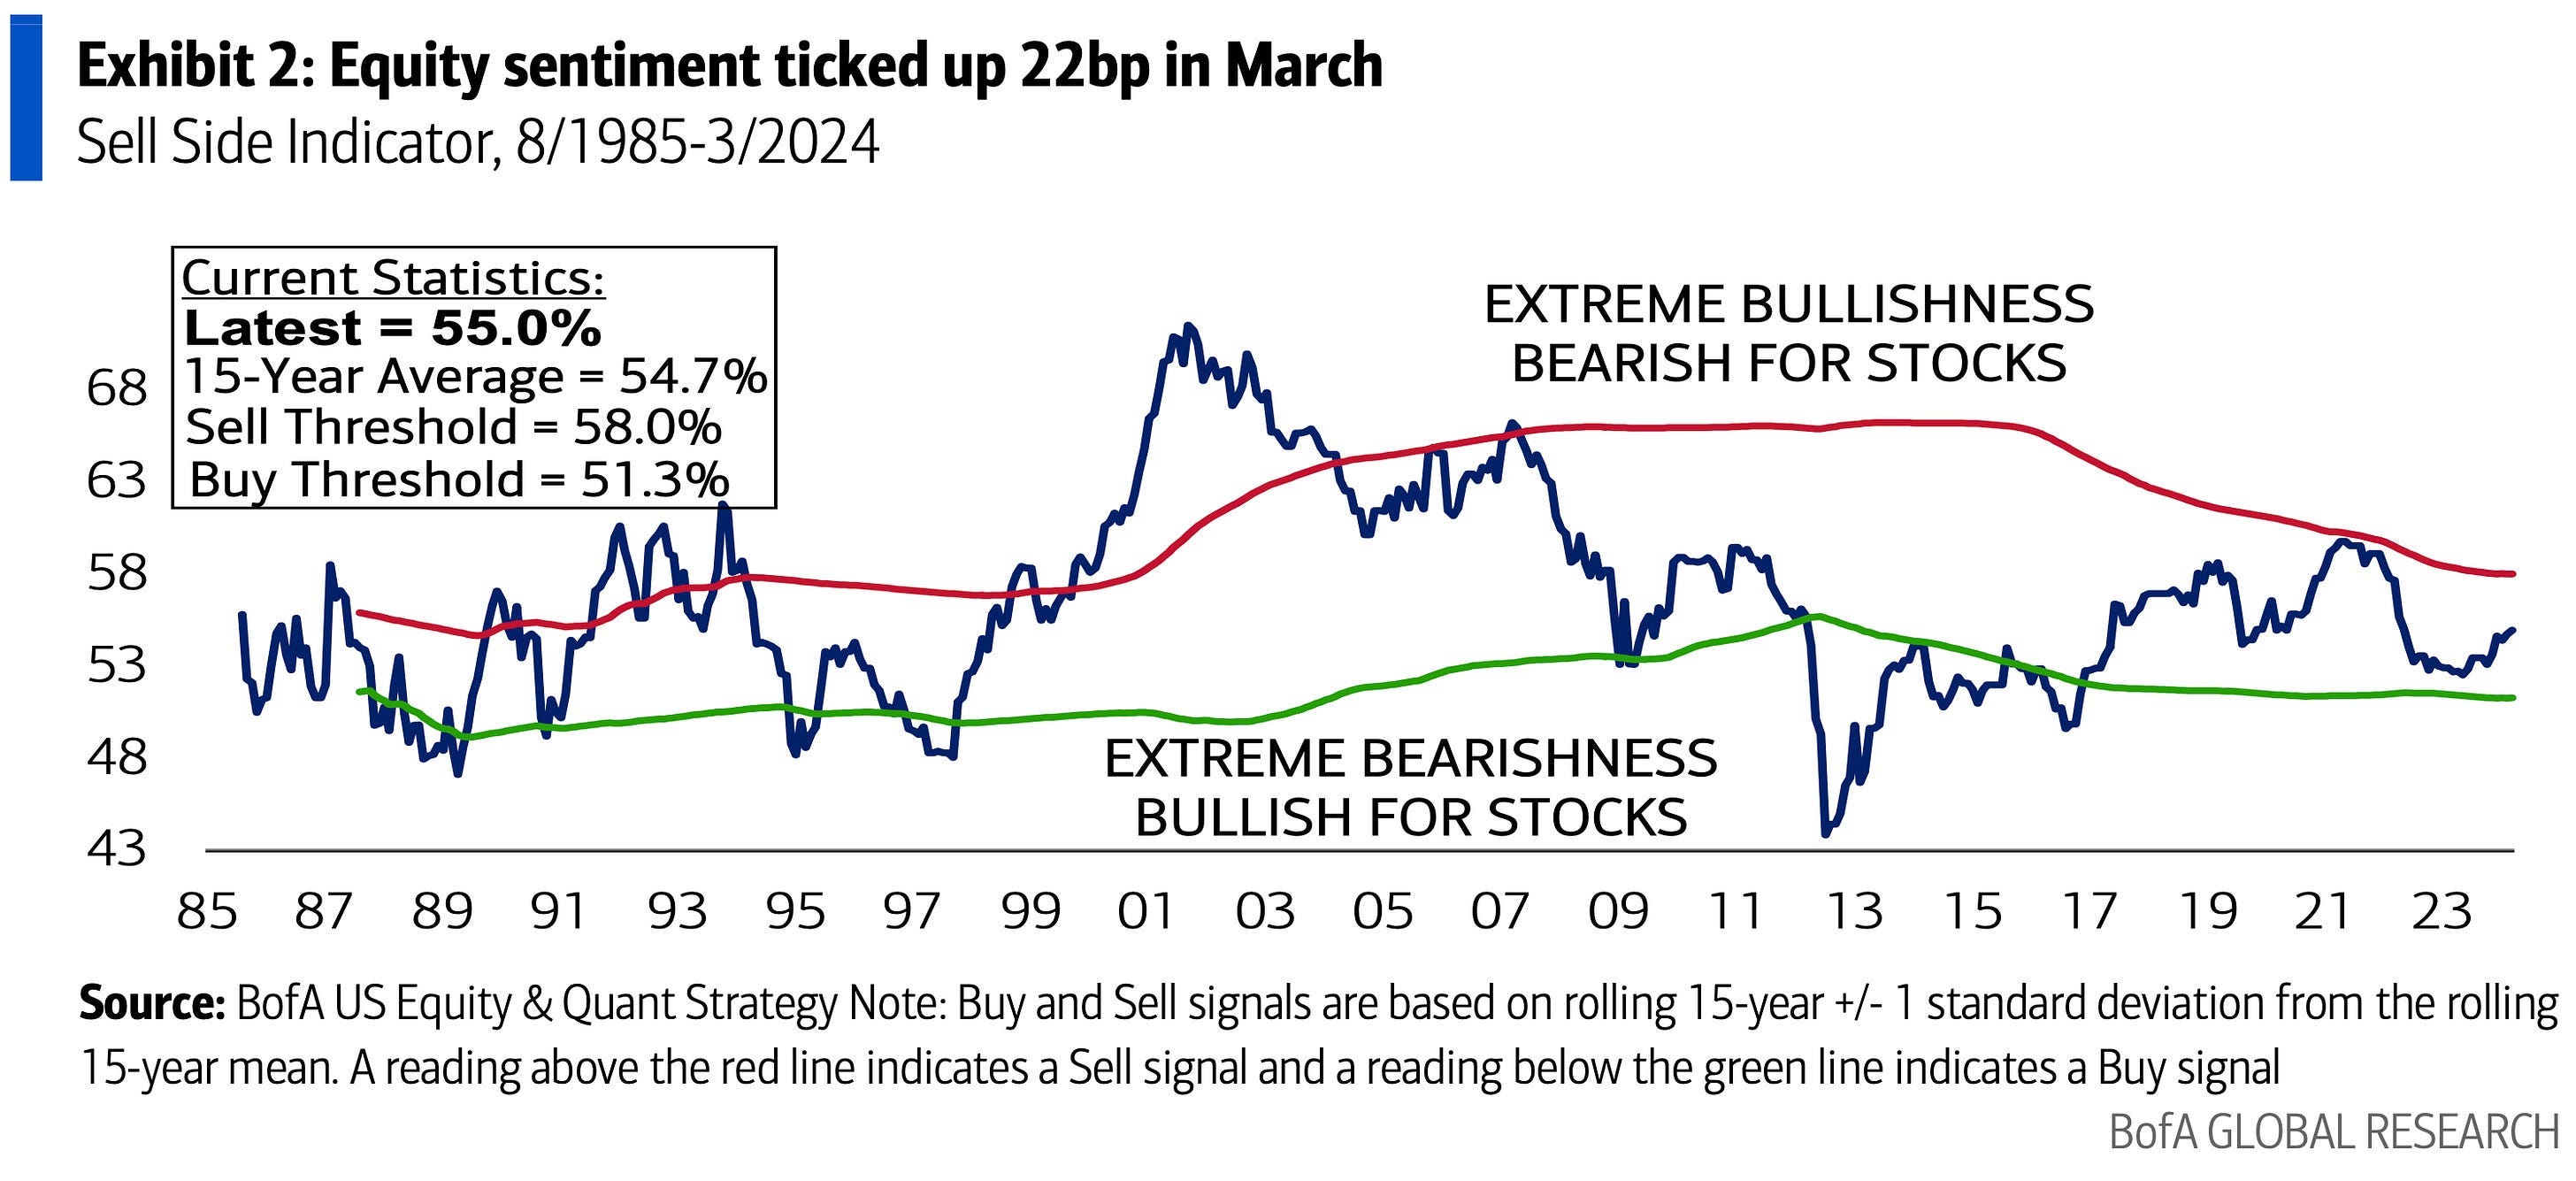
BofA's Sell Side (Wall Street brokerage firms) indicator ticked up 22 basis points to 55.0% in March, the highest level since May 2022, but nowhere near euphoria.
As Jurrien Timmer of Fidelity (@TimmerFidelity) said: “With the S&P 500 equal-weighted index (SPW) gaining another 1% last week, this broad measure of the market has now gained 8% year-to-date and 36% since the bull market started in late 2022. That remains shy of the 51% gain for the cap-weighted index (SPX), but it’s a respectable performance considering how narrow the market was until last October, when the market peered into an abyss of “higher-for-ever rates.”
“But it survived that retest, and since that October 27th low the SPW is up 27.8% and the SPX is up 28.4%. Neck and neck. After a tediously narrow start in 2023, the tape has turned green and broad, with 86% of stocks in the S&P 500 in long-term uptrends (i.e., above their 200-day moving average). If that’s not a bullish broadening, I don’t know what is. The market has survived not only diminished expectations of rate cuts, but also a fraying within the Mag 7. It’s heartening to see, and it shows the power of earnings to take over in the heavy lifting department.”
The S&P 500 bottomed 17 months ago on October 13, 2022. Now that we are 17 months into a bull market cycle, it’s worth asking how much life there is left. Cyclical bull markets can be as modest as 48% (1966-1968) or as grand as 200% or more (1982-1987, 1994-1998). Over the past 100 years, the median bull market has produced a gain of 90% spanning around 30 months. By that measure there should be some life left for this cycle.
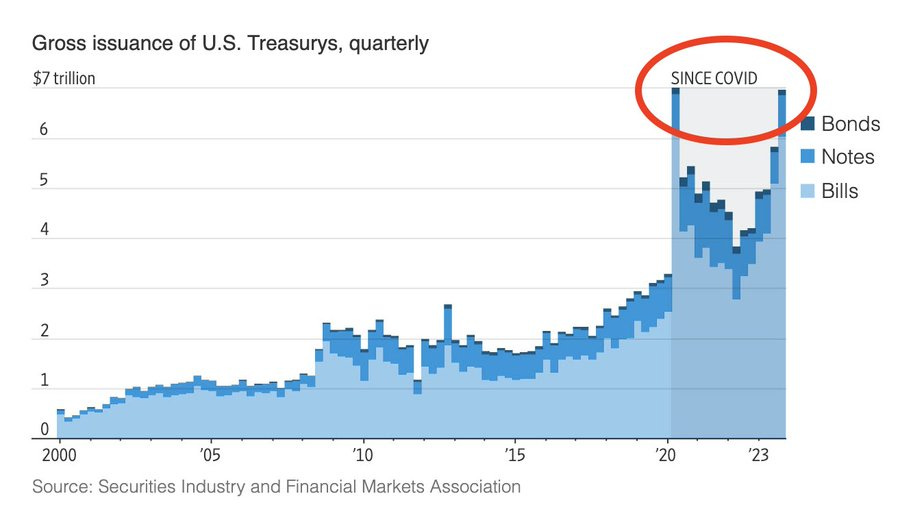
There is one disgusting statistic that worries me. Issuance of US Treasuries are now at pandemic levels: We saw nearly $7 trillion in gross issuance of US Treasures in just 3 months during 2023. For the entire year of 2023, a whopping $23 trillion were issued. US government spending as a percentage of GDP is at World War 2 levels. Of course we have a “strong” economy when US federal debt is rising by $1 trillion every 90 days right now.
There's plenty of blame to go around. The Biden Administration proposed a giant budget deficit. Congress approved it. Treasury Secretary Yellen is selling bonds to fund it. The Fed is making sure banks have enough liquidity to buy the bonds. Any of these worthies could put a stop to this disaster, but they aren't because they gain while you lose.
h/t @KobeissiLetter
Portfolio Protection
If you still are worried about a short-term market decline and bought either the April 30 SPY $505 put (SPY240430P00505000) or the April 30 SPY $410 put (SPY240430P00410000), it is time to roll them out to reduce the loss from declining time to expiration. The $505 put closed today at $2.75 and can be sold and replaced by the June 21 SPY $505 put (SPY240621P00505000) at $7.12. The $410 put closed today at 11¢ and can be replaced by the June 21 SPY $410 put (SPY240621P00410000) at 79¢.
Remember that these are insurance puts and, like any insurance premium, they are more likely to cost you money than pay off. If you can hold through a transient market dip or don't want to mess with options, don't do it.
Market Outlook
The S&P 500 lost 2.0% since last Thursday as the market priced in “high – but not higher – for longer.” The Index is up 7.9% year-to-date. The Nasdaq Composite also lost 2.0% and is up 6.9% for the year. The SPDR S&P Biotech Exchange-Traded Fund (XBI) was clobbered for 5.7% as long Treasury yields climbed. It is barely up 0.2% year-to-date. The small-cap Russell 2000 dropped 3.3% and is up only 1.3% in 2024.
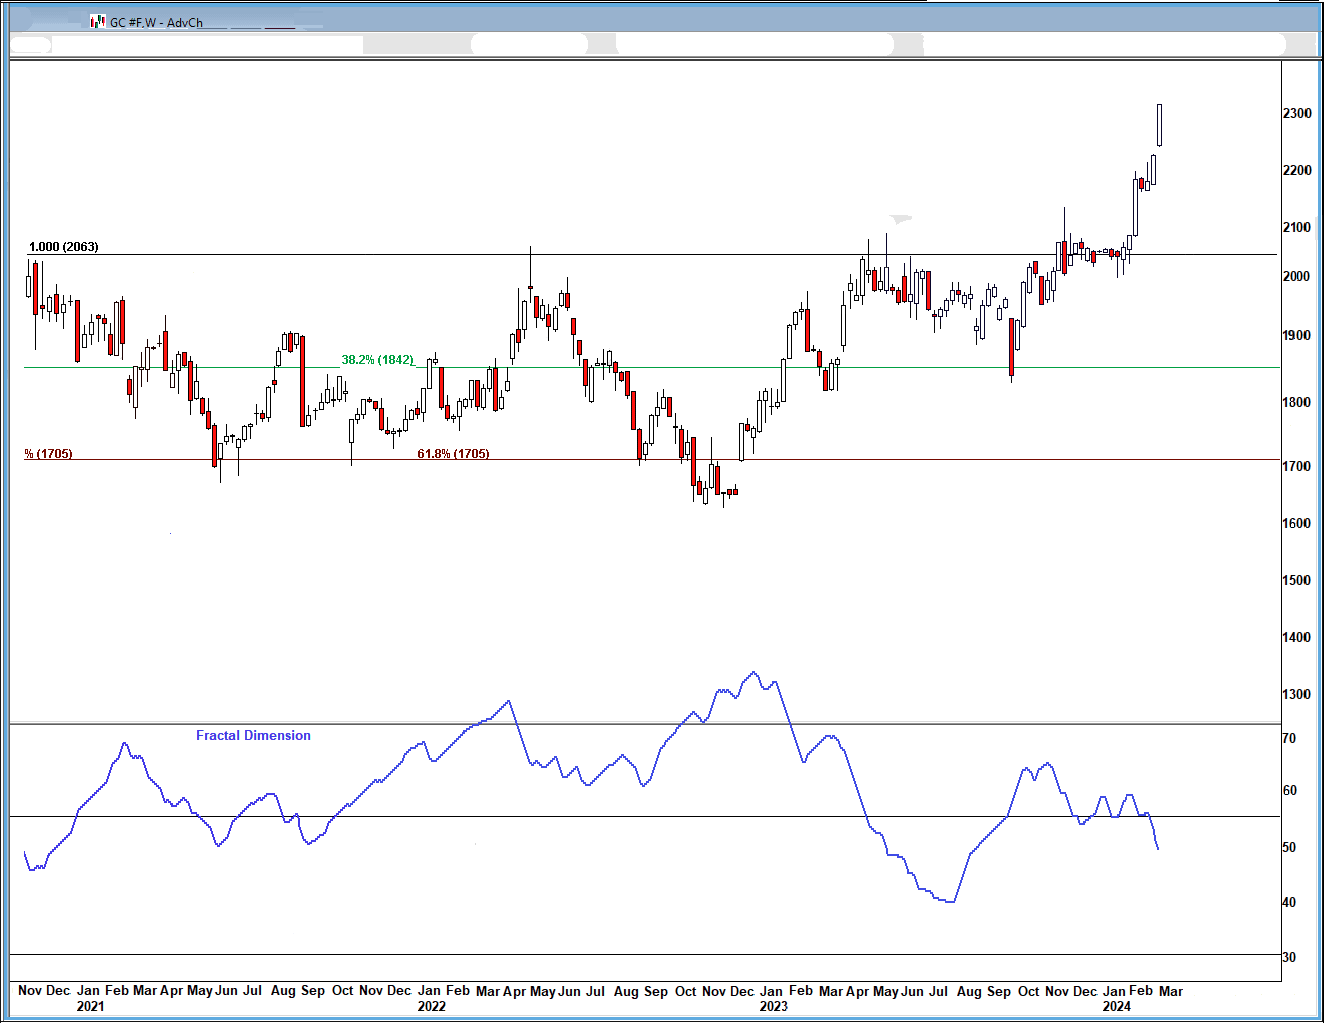
The fractal dimension finally reversed, marking the end of the uptrend. It has a long way to go to consolidate such a huge move, which means either a sharp drop or – more likely – months of churning, possibly all the way to the election.

Economy
The Atlanta Fed's GDPNow model forecast for March quarter real GDP growth ticked down from +2.8% to +2.5% due to weaker exports.

Precious Metals
Gold set six straight record highs to close over $2,300 yesterday for the first time ever. Silver just hit its highest level since March 2022. Is the long-awaited silver squeeze on the fraudsters happening? Costco is now selling silver bars in Canada with strict limits and no refunds.

h/t @KatusaResearch
Normally, gold goes up when the outlook for interest rates is lower, and gold goes down when the outlook shifts to higher. For the past few weeks, Treasury yields have trended higher and Wall Street gurus have trimmed their outlook for Fed rate cuts, yet gold has surged to an all-time high.
That tells you two things: (1) demand for gold is really strong; and, (2), something else may be going on. “Something else” may be the early recognition that $1 trillion in new debt every 90 days may keep the economy humming, but could be devastating for the dollar. We shall see. If you feel the need for actual gold or silver in your pocket, my friend Kieth Fitz-Gerald recommended Asset Strategies.
The fractal dimension said: “I am gold; hear me roar.” A new trend has started with a lot of energy to power it.
Crypto
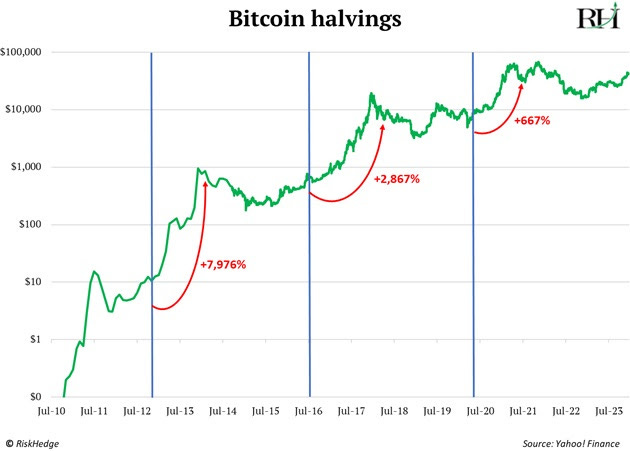
The bitcoin halving is less than three weeks away. When bitcoin started in 2009, miners earned 50 BTC every 10 minutes (or “per block”). That’s the sole way new bitcoin is created.
Bitcoin’s creator programmed it to cut these rewards in half every four years. Hence the name “halving.” In 2012, rewards dropped to 25 BTC. Four years later, they were slashed to 12.5 BTC. The third halving happened in May 2020, with issuance being cut to 6.25 BTC.
This matters because each halving ignited a huge run-up in bitcoin’s price:
h/t @DisruptionHedge
Bitcoin is volatile, no doubt, but you can use that to your advantage by adding a little on each big dip – like now.
Coming Events for Free Subscribers
All times below are ET.
Monday, April 8
Solar Eclipse!
Tuesday, April 9
Short Interest - After the close
Wednesday, April 10
Consumer Price Index - 8:30am
Golden Age Portfolio Update
After last week's +1.0%, this was a give-back week as the portfolio dipped 1.0%. We're now up 21.4% in 2024 with much more to come. Let's dig in...
* * * * * * * * * * * * * * * * * * * * * * * * * * * * * * * * * * * * * * * * * * * * * * * * * * * * * * *
Seed Oils are enemy #1, then comes Sugars and Refined Carbs

h/t @bava23
* * * * * * * * * * * * * * * * * * * * * * * * * * * * * * * * * * * * * * * * * * * * * * * * * * * * * * *
Former Obama National Security Advisor turned BlackRock CEO, Tom Dillon,
on the New World Order
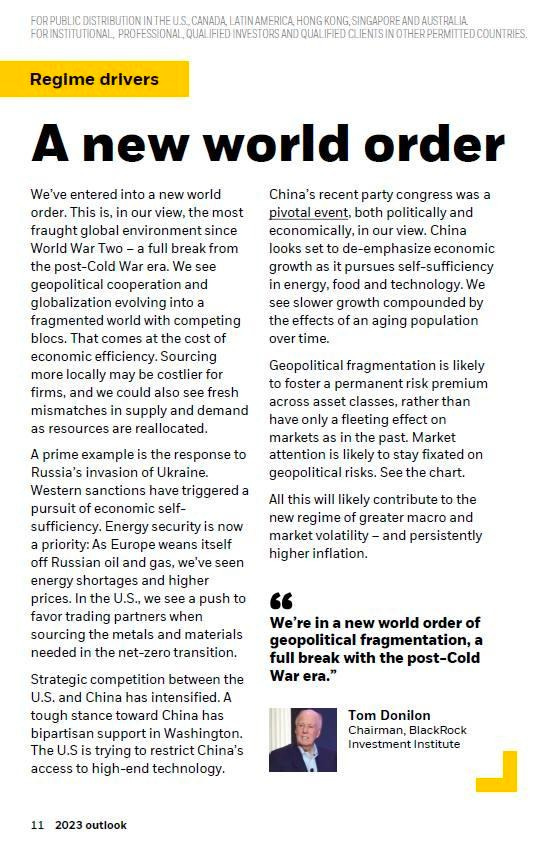
h/t @WillHild
* * * * * * * * * * * * * * * * * * * * * * * * * * * * * * * * * * * * * * * * * * * * * * * * * * * * * * *
Your reading about The Coming of Neo-Medievalism and the Great Decentralization Editor,

Paid subscriber or not, if you would click the ♥ symbol below it would really help me get the word out.