


2/5 – 2/9 Red Rock Update
2/5 – 2/9 Red Rock Update
Building Wealth in the Secular Bull Market to 2036
Stocks peak about every 36 years, most recently in 1929, 1965, and 2000. This 36 year cycle can be traced all the way back to the earliest eras in recorded human history, back to Pythagoras and Plato and the Axial Age around 600BC. After each peak comes a period of decline (punctuated by bear market rallies) that typically lasts 16 years or so. Then, with the excesses of the prior bull period wrung out and investors most depressed, the next 20-year run to the next market top can begin.
Howdy, Bull-Riders:
I have a new recommendation for paying subscribers this week – an energy company selling for a 25% Free Cash Flow yield, a P/E ratio under 3x, and a fraction of book value. It's right under the paywall.
Last Friday, stocks rallied sharply after December payroll additions were revised up from +216,000 to +333,000. We learned that the US added another 353,000 jobs in January, the most since January 2023, nearly twice the consensus estimate (180,000) and the largest increase in a year. Or did we? Wait – January?
Every year in January, the Bureau of Labor Statistics conducts its “annual re-benchmarking and update of seasonal adjustment factors.” Long story short, what was until December some mediocre jobs numbers have now been miraculously transformed into substantial gains, as shown in the chart below. While the seasonally adjusted January payrolls were up 353,000, the unadjusted was down 2.635 million.
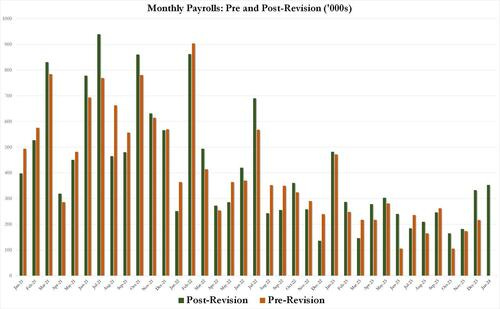
h/t @zerohedge
A comparison between the revised BLS Payrolls number and the ADP payrolls show the BLS numbers are now clearly rising even as the impartial ADP (which directly logs employment numbers at the company level and is actually far more accurate), shows an accelerating slowdown.
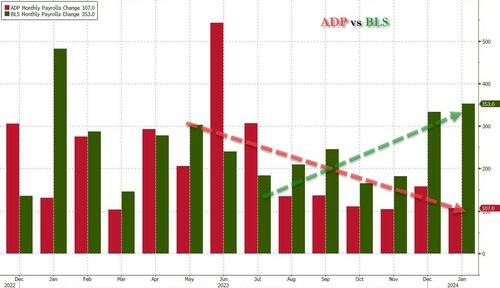
h/t @zerohedge
And the the latest divergence between the Establishment (payrolls) survey and the much more accurate Household (actual employment) survey showed that in contrast to the BLS claim that January added 353,000 jobs, the Household survey found that the number of actually employed workers dropped again, this time by 31,000 from 161,183.000 to 161,152,000.
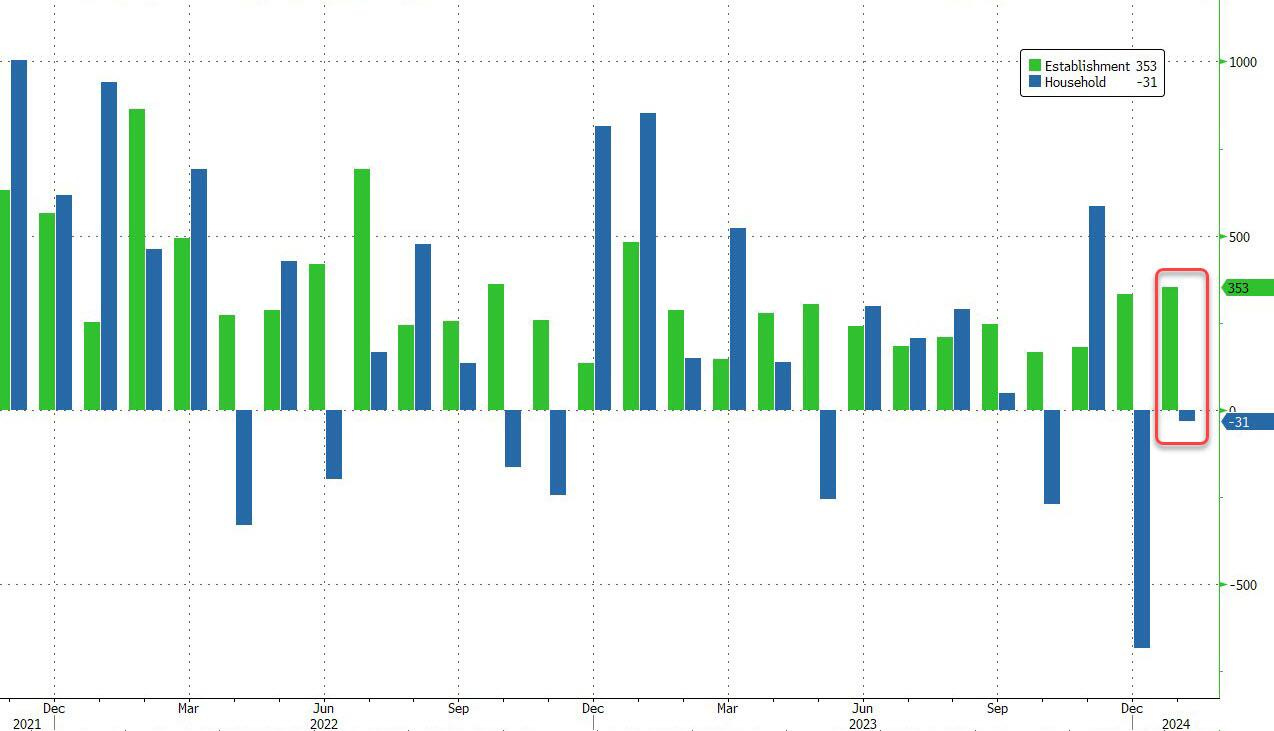
h/t @zerohedge
The problem here is the Establishment survey contacts larger firms to answer hiring questions and then estimates small business job creation based on the large companies answers. If there is stress that’s specific to smaller business, as there is now, the estimates will be far too rosy.
Most of those new jobs are part-time as people take on second and third jobs to cope with past inflation. Full-time jobs aren't growing:
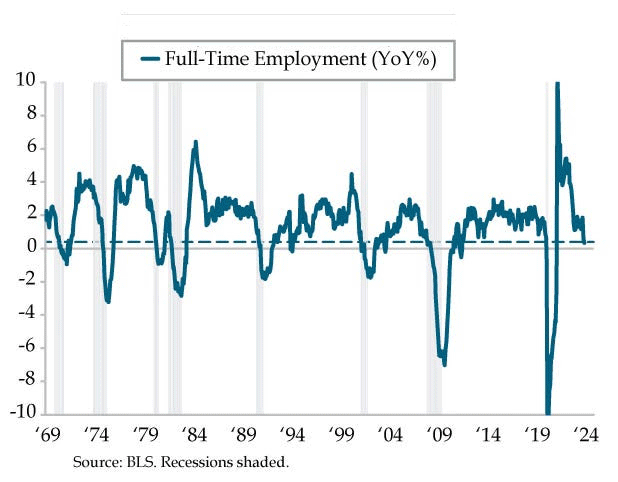
h/t @DiMartinoBooth
And according to outplacement firm Challenger, Gray & Christmas , job cut announcements in January increased to its highest level in 10 months, a 136% surge from December. But Wall Street bought the BLS numbers and stocks rallied.
Those high spirits took a knock after Powell, in a 60 Minutes interview that aired last Sunday, doubled down on his midweek message that the central bank will tread cautiously in deciding when to cut rates. He said the “danger of moving too soon is the job's not quite done” in quelling inflation.
High – but not higher – for longer. Where have I heard that before?
Money Supply
M1 is a measure of cash and coins in circulation, as well as demand deposits in checking accounts. It's money that can be easily accessed and spent by consumers.
The M2 money supply is everything in M1 plus savings accounts, money market funds, and certificates of deposit (CDs) below $100,000. This money can also be spent by consumers, but it requires a little extra work to access it.
Growing economies require more capital in circulation to facilitate transactions, which results in M2 increasing virtually every year. But it's those rare instances where M2 does decline, and consumers are forced to forgo some of their purchases, that have resulted in trouble for the US economy and Wall Street. M2 peaked at roughly $21.7 trillion in July 2022. As of December 2023, M2 sat at approximately $20.87 trillion.

h/t @stlouisfed
That chart doesn't look like much of a downturn, but look at the percentage drop from its high:
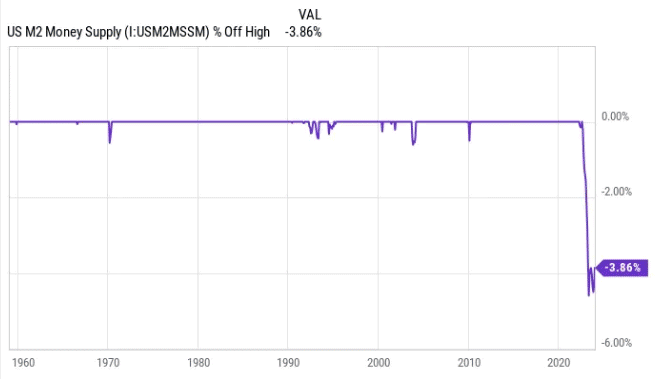
h/t @themotleyfool
M2 has fallen by 1.68% on a year-over-year basis and 3.86% since its summer 2022 peak. This represents the first meaningful decline in M2 since the Great Depression.
On a nominal basis, a 3.86% drop probably doesn't sound like much. In fact, with M2 expanding by a record 26% on a year-over-year basis during the pandemic, a reasonable argument could be made that a 3.86% retracement since mid-2022 is nothing more than a reversion to the mean for money supply. Could be.
But in the past, M2 drops of 2% or more have been signs of an economic downturn. There have been only five instances since 1870 where M2 has fallen by at least 2%: 1878, 1893, 1921, 1931-1933, and July 2022-currently. All four previous instances led to deflationary depressions and a sizable increase in the U.S. unemployment rate.

The depressions in 1878 and 1893 occurred before to the creation of the Fed. With the tools available now, it's highly unlikely a depression would happen. But history suggests that significant declines in the M2 money supply shouldn't be ignored. A recession is coming, even if Wall Street doesn't believe it.
Market Outlook
The S&P 500 added 1.9% since last Thursday, cleared 5000 today, and has traded higher on the calendar week for 13 of the last 14 weeks, which has not happened in almost 30 years. The Index is up 4.8% year-to-date.
So are investors all in? As if! Since the start of 2024, investors have pulled $29.2 billion from the SPDR S&P 500 ETF Trust (SPY), the largest outflows of any ETF by far, and larger than any annual outflow for SPY, other than 2015’s $32.3 billion.
How narrow can the rally be when more than two-thirds of the stocks in the S&P 500 have 50-day averages above their 200-day averages? That's the best level in more than two years and is still rising.
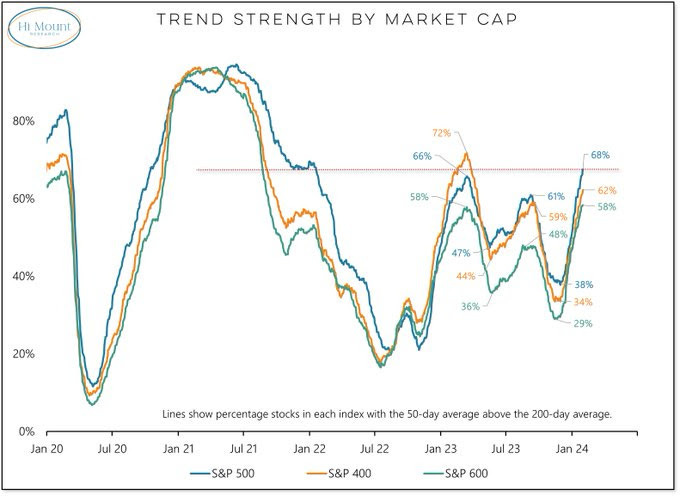
h/t @dailychartbook
The Nasdaq Composite gained 2.8% as Big Tech came back in favor. It is up 5.2% for the year. The consolidation / break-up tango is continuing:
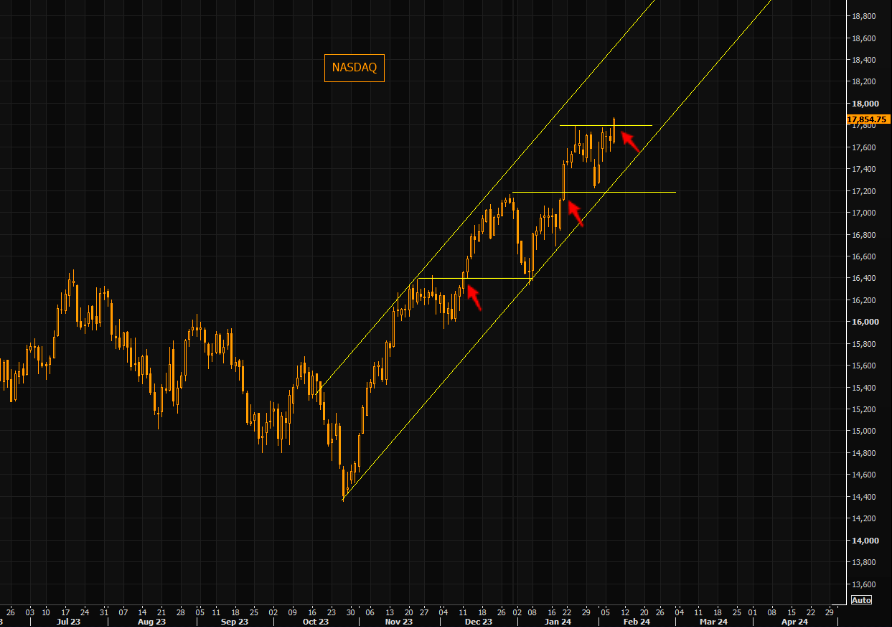
h/t @themarketear
But it's concerning that despite the Composite hitting multiple new highs in recent weeks, more stocks have been falling to new lows than new highs. This is a highly unusual split that has typically preceded weak returns.
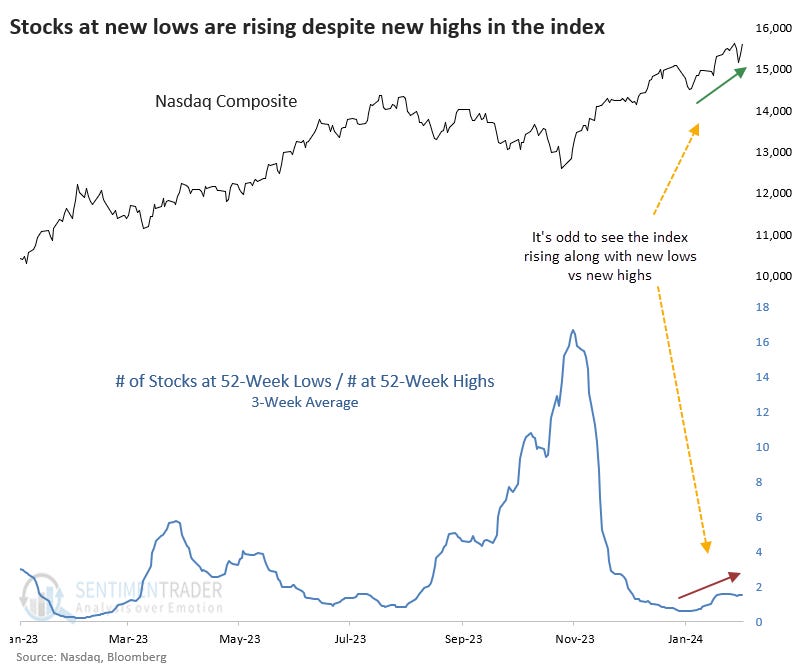
h/t @sentimentrader
The SPDR S&P Biotech Exchange-Traded Fund (XBI) climbed 2.8% but is just flat year-to-date. The small-cap Russell 2000 eked out a 0.3% gain and is down 2.3% in 2024. As @BobEUnlimited pointed out, we have to consider whether the relative cheapness of an index is appropriate given the fundamentals. The underperformance of the Russel 2000 compared to Nasdaq probably is in large part driven by the significant divergence in the level and trend of earnings.
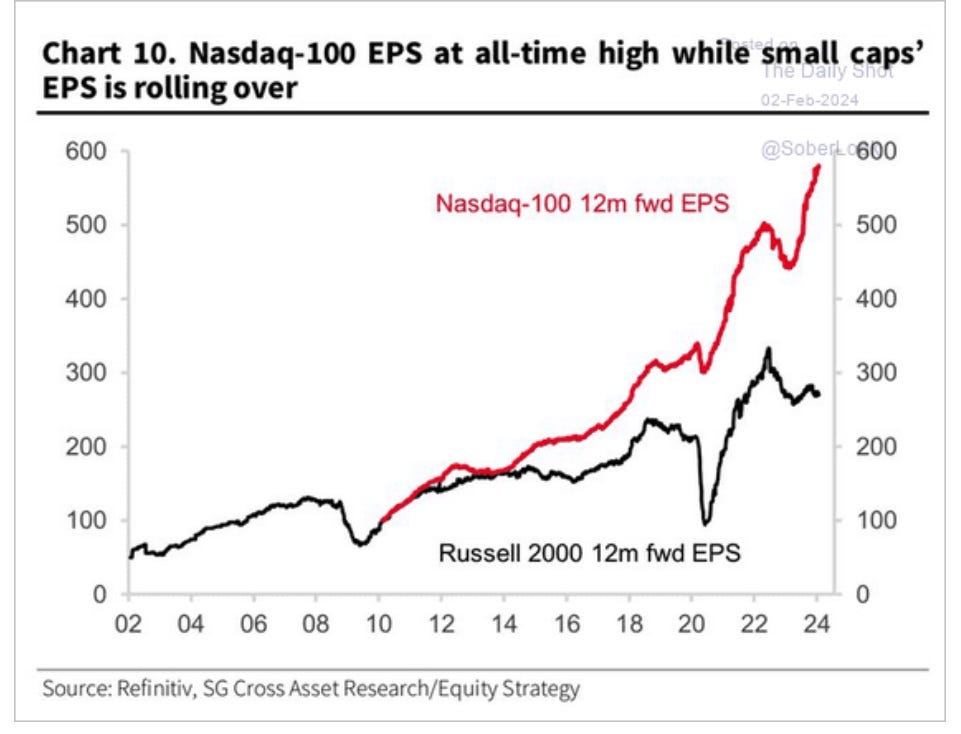
h/t @BobEUnlimited
And most days it feels like:

h/t @BeenThereCap
In this new bull market, the S&P 500 is now up 36.7% from its October 12, 2022 closing low of 3,577.03. The prior bear market saw the index fall 25.4% over 282 days.

h/t @bespokeinvest
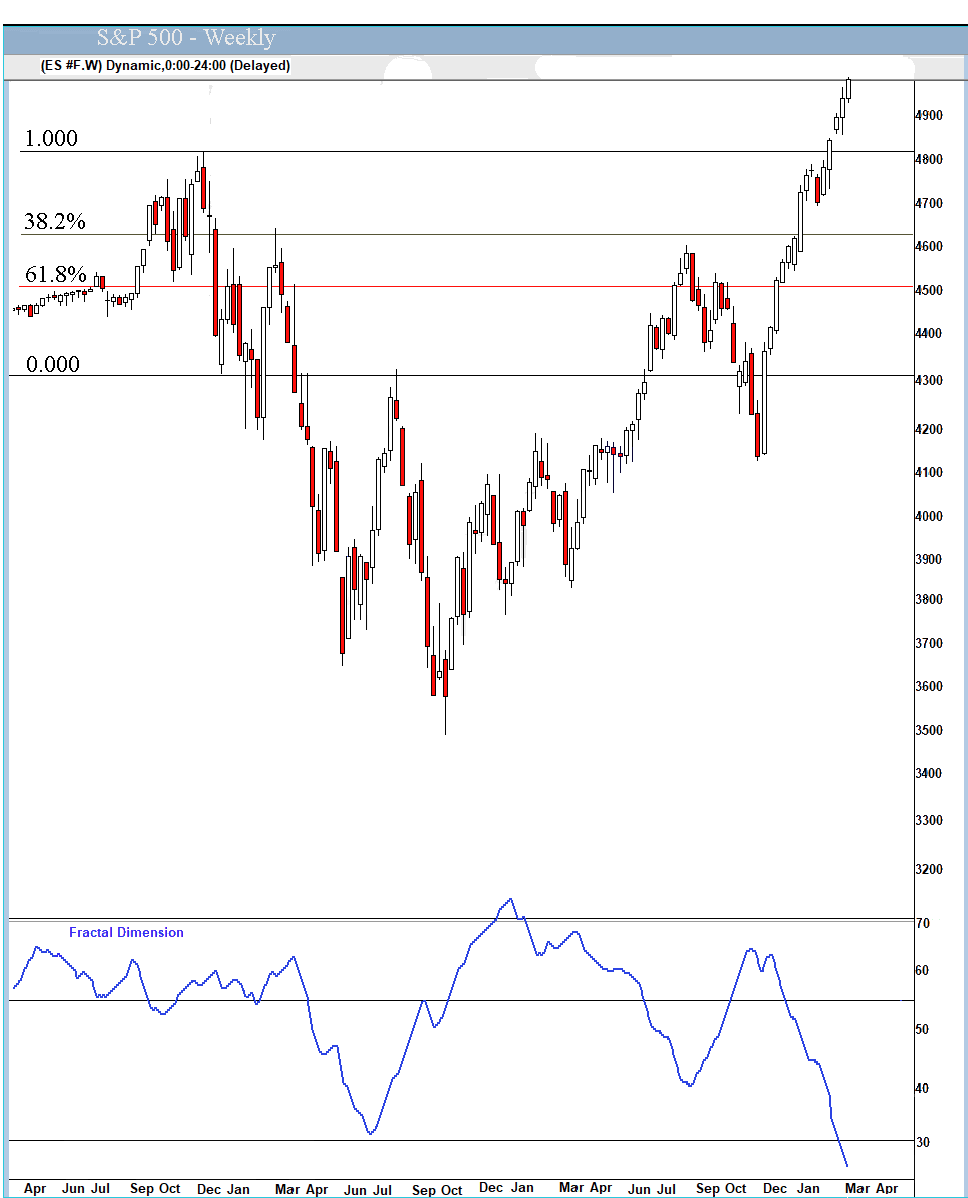
The fractal dimension is extended below 30, meaning this rally is done. Yes, it could go further – Wall Street loves round numbers, so an S&P 500 close over 5,000 was in the cards. Maybe it will keep going up through Nvidia's earnings report on February 21, but we are on very thin ice.
February is the third-worst month for the S&P 500 on average over the last 30 years, particularly the last two weeks, and especially true in election years.

h/t @Mayhem4Markets
But the uptrend that started in late November 1971, which this one resembles, rallied for 15 weeks initially (this one 13 weeks), had a 3 week pullback, then made a multi week high on week 20. IF – big “if” - the 2023-2024 rally keeps resembling it, the next multi-week high will happen in March around 5110.
Goldman's sentiment indicator is rising but is not yet stretched.

h/t @dailychartbook
Stocks will outperform bonds as long as the economy keeps going. The economy will keep going as long as stocks and home prices don't fall too much. Prices of stocks and homes won't fall too much as long as bond yields don't rise too high for too long.
Economy
The Citi Economic Surprise Index is at its highest since November.
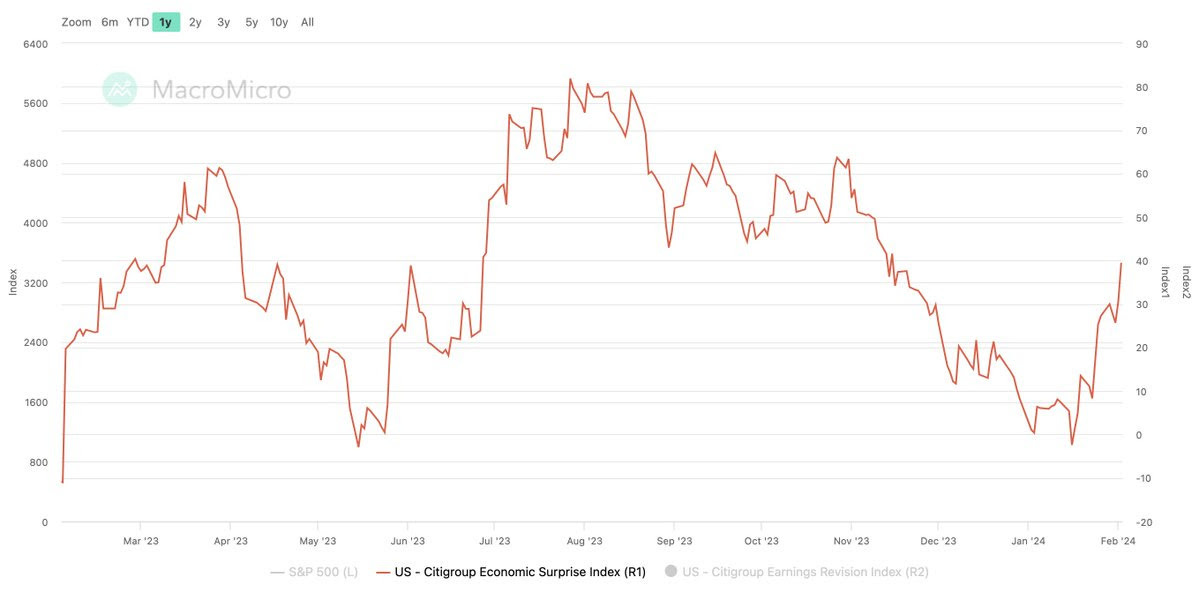
h/t @dailychartbook
Golden Age Portfolio Update
This was another excellent week for the portfolio as it jumped 5.1% to another all-time high. We're now up 12.5% in 2024 with much more to come. If you want to make money this year, please subscribe! Let's dig in...
* * * * * * * * * * * * * * * * * * * * * * * * * * * * * * * * * * * * * * * * * * * * * * * * * * * * * * * * * * * * *
La Invitación
* * * * * * * * * * * * * * * * * * * * * * * * * * * * * * * * * * * * * * * * * * * * * * * * * * * * * * * * * * * *

h/t @WinfieldSmart
* * * * * * * * * * * * * * * * * * * * * * * * * * * * * * * * * * * * * * * * * * * * * * * * * * * * * * * * * * * * *
Your learning about the House of Wisdom Editor,

Paid subscriber or not, if you would click the ♥ symbol below it would really help me get the word out.