


1/8 – 1/12 Red Rock Update
1/8 – 1/12 Red Rock Update
Building Wealth in the Secular Bull Market to 2036
Stocks peak about every 36 years, most recently in 1929, 1965, and 2000. This 36 year cycle can be traced all the way back to the earliest eras in recorded human history, back to Pythagoras and Plato and the Axial Age around 600BC. After each peak comes a period of decline (punctuated by bear market rallies) that typically lasts 16 years or so. Then, with the excesses of the prior bull period wrung out and investors most depressed, the next 20-year run to the next market top can begin.
Howdy, Bull-Riders:
Last Friday's payroll number was stronger than expected and yesterday's December Consumer Price Index announcement came in hotter than expected. In part, it was driven by base effects – a low December 2022 number - and will drop significantly next month due to...base effects. The headline annual increase was 3.4% year-over-year (YoY), just above the 3.2% estimate and November's 3.1%. The month-over-month (MoM) increase was 0.3% versus estimates of 0.2% and last month’s 0.1%.
However, the shelter index, which is 32% of the CPI, was up 0.5% from November and accounted for over two-thirds of the total annual increase. Everybody knows it is a lagged measure that even the Bureau of Labor Statistics has written about and acknowledged the 4-6 quarter lag. Most importantly, the Fed knows this.
Here is a breakdown of the categories that impacted inflation. The second and third largest drives are rent:

h/t Daily Economics
The bulk of all inflation now is rent (the yellow bars):

h/t @JosephPolitano
Annual core inflation down-ticked to 3.9% from 4.0% in November, just above the 3.8% expected. MoM core inflation rose 0.3%, in line with expectations and unchanged from November. It was an unsurprising, no-big-deal report. The Fed is likely to continue to pause at its January 31 meeting.
There are two more CPI reports and a couple of nonfarm payrolls releases before the March 20 meeting. The Dallas Fed President Lorie Logan noted some concern about markets getting ahead of the Fed on rate cut expectations: “We can’t count on sustaining price stability if we don’t maintain sufficiently restrictive financial conditions.” As I've been saying, High (but not higher) for Longer. Think of it as The Pause That Refreshes.
So why did the stock market sell off sharply yesterday morning? Because the first traders are computers and AI bots that “read” the headline and then short any downside surprise or buy any upside surprise. Then the daytraders pile on, followed by retail bagholders who sell to the computers at the bottom, just before the market turns up. Being able to ignore this noise is your superpower.
The January Effect
Last week, stocks snapped a nine-week winning streak as the S&P 500 had its worst start since 2016.
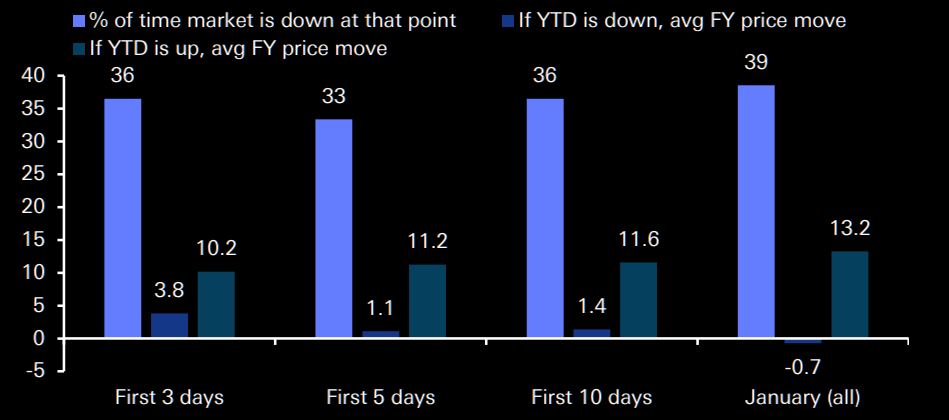
Since 1950, when the S&P 500 has logged gains over the first five trading days of the year, it had an average return of 14.2% for the whole year. When it was down over the first five days, it recorded an average return of 0.3% for the full year. According to Deutsche Bank: “When the S&P 500 is down at various points in January, the full-year performance tends to notably underperform the long-term average. When up, it notably outperforms.”
h/t The Market Ear
Market Outlook
The S&P 500 added 2.0% since last Thursday in spite of a strong payrolls number and above-consensus inflation. Could we be entering a time when good news is good news instead of good news equals Fed increases? The Index is up 0.2% year-to-date. The Nasdaq Composite gained 3.2% but is down 0.3% for the year. The SPDR S&P Biotech Exchange-Traded Fund (XBI) climbed 1.1% and just witnessed the best two-month stretch EVER for the sector. It has seen eight consecutive weeks of gains, up +14% in November and +18% more in December, or 39% from the October lows. It is up 1.3% year-to-date. The small-cap Russell 2000 dropped 0.1% and still is underperforming, down 3.5% in 2024.
The fractal dimension kicked back into trend mode, so I expect another three or four weeks of upside before the next consolidation. Remember that consolidations can be anything from weeks of churning – a time consolidation – to a sharp move in the opposite direction – a price consolidation.

December quarter earnings releases are about to start. BofA says the strong Bloomberg Economic Surprise Index suggests a strong earnings beat.

h/t @dailychartbook
Economy
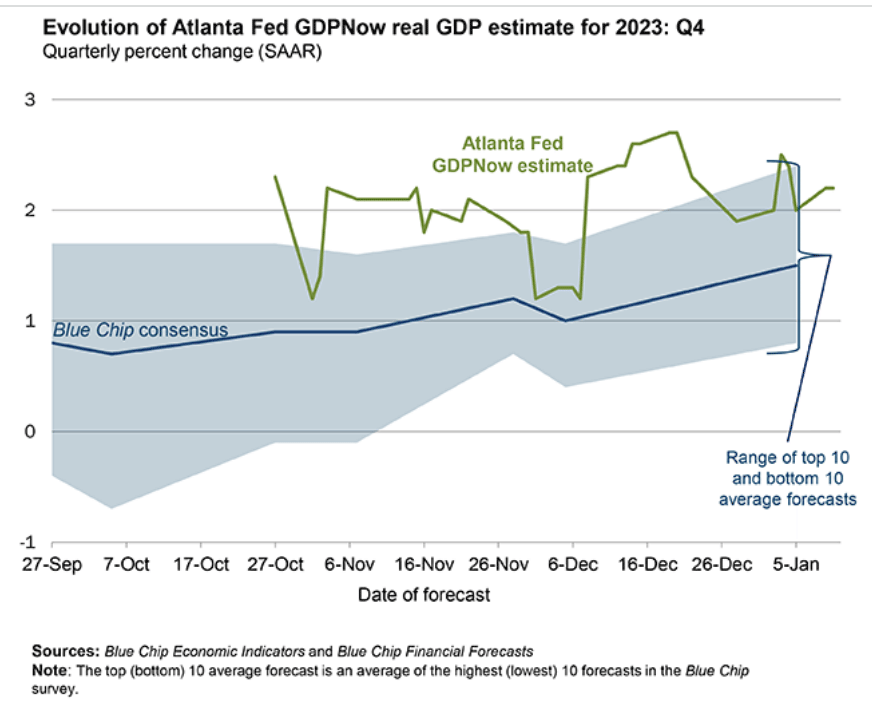
The Atlanta Fed's GDPNow model estimate of December quarter real GDP growth has down-ticked a bit to +2.2% while the Blue Chip economists are catching up. 2.0% to 2.5% growth will look like a soft landing to the Fed.
Coming Events
All times below are ET, and most presentations and slides are archived on the companies' websites so you can listen to them.
Monday, January 15
Markets Closed - MLK day
Golden Age Portfolio Update
This was a good week for the portfolio as it jumped 3.9%, more than offsetting the first week's decline as Big Tech was hit.. We're now up 1.2% foe 2024 with much more to come. Let's dig in...
* * * * * * * * * * * * * * * * * * * * * * * * * * * * * * * * * * * * * * * * * * * * * * * * * * * * * * * * * * * * *
The 2024 Global Risks Report from the World Economic Forum, based on the opinions of 1,500 experts, ranks misinformation and disinformation as the #1 societal risk in the next two years. As @NateSilver538 said: “If the experts think that misinformation is a bigger problem than war, then a way bigger problem than misinformation is that the experts are f**king idiots.”

h/t @Sander_vdLinden
* * * * * * * * * * * * * * * * * * * * * * * * * * * * * * * * * * * * * * * * * * * * * * * * * * * * * * * * * * * * *
Your checking the best free and paid resources for professional investors Editor,
Paid subscriber or not, if you would click the ♥ symbol below it would really help me get the word out.