


1/22 – 1/6 Red Rock Update
1/22 – 1/6 Red Rock Update
Building Wealth in the Secular Bull Market to 2036
Friday morning the Fed's favorite inflation indicator, the “core” Personal Consumption Expenditures index that excludes volatile food and energy prices. clocked in at 2.9% for the month of December, down from 3.2% in November and beating estimates for 3.0%. It was the first time the core PCE fell below 3% since March 2021. Even better, the core PCE inflation rate fell to 1.5% on a three-month annualized basis, its lowest since late 2020. On a six-month basis it was 1.9% for the second month in a row. Both of those marks are below the Fed's 2% target.

Does this mean the Fed starts cutting rates at next Wednesday's meeting? Of course not. But as I've been saying, rate hikes are a thing of the past. Now Wall Street has to get used to High-But No Higher–for Longer.
The final Atlanta Fed GDPNow model estimate for December quarter real Gross Domestic Product (GDP) was +2.4%, stronger than the Blue Chip economists' consensus for +1.5%. The first government announcement yesterday morning was an even stronger +3.3%. September quarter GDP was revised down to +4.9%, and I expect December to be revised down a little in the second and third estimates coming in February and March. But it was a good quarter, no doubt.

But the market is forward-looking, so what's next? According to S&P Global's flash US composite PMI, which includes both the services and manufacturing sectors, activity rose to 52.3 in January, up from 50.9 in December and better than the 51.0 that had been expected by economists.
S&P headlined: “Output growth fastest for seven months at start of 2024, prices charged rise at slowest rate since May 202.” They said business confidence reached a 20-month high while prices charged, a measure of inflation, rose at its slowest pace since May 2020. The manufacturing index saw the largest increase with a reading of 50.3 up from 47.9, the month prior. The services index hit 52.9 in January, up from 51.4 in December.
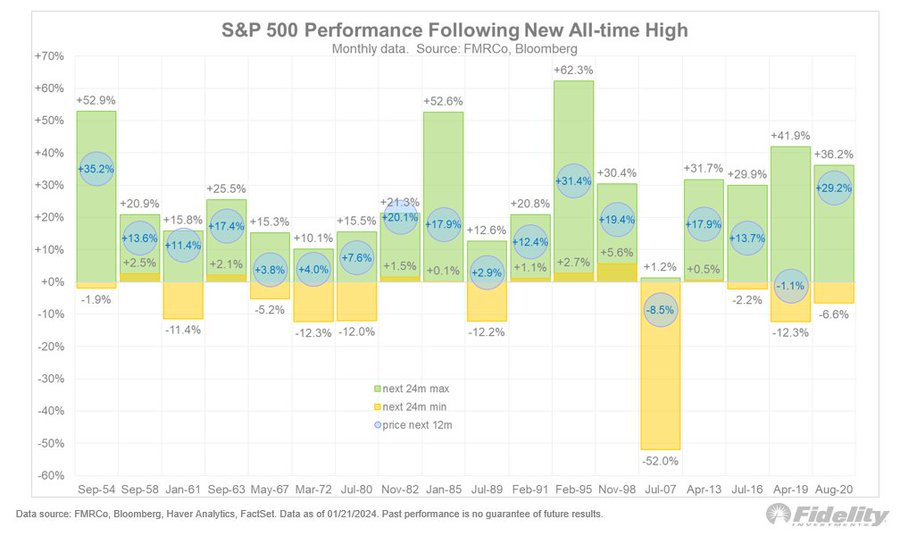
As I said last week, the returns following an all-time high (ATH) in the stock market usually are above average. The all-12-month returns average 8.5% with a 73% batting average, The 12-month returns after an ATH average 13.8% with an 89% batting average. Yes, the first month after an ATH can be rocky as those who are scared of heights bail out, but after that the statistics are pretty compelling.
Of course, there will be ups and downs during the uptrend. This chart shows the best and worst case historical outcomes during the 24 months following a new all-time high.
h/t @TimmerFidelity
Most of the time the upside momentum keeps the drawdowns modest (which results in a favorable upside/downside ratio), but there have been cases where subsequent drawdowns were in the double-digits. The new ATH in March 1972 happened nine months before the start of a 48% bear market. The new ATH in July 1980 happened right as the economy was about to enter Dip #2 of its double-dip recession. The prize for worst whipsaw was the new ATH in July 2007, right before the Global Financial Crisis caused a 57% decline. But most of the time, new ATHs confirm the uptrend, which brings upside momentum with it.
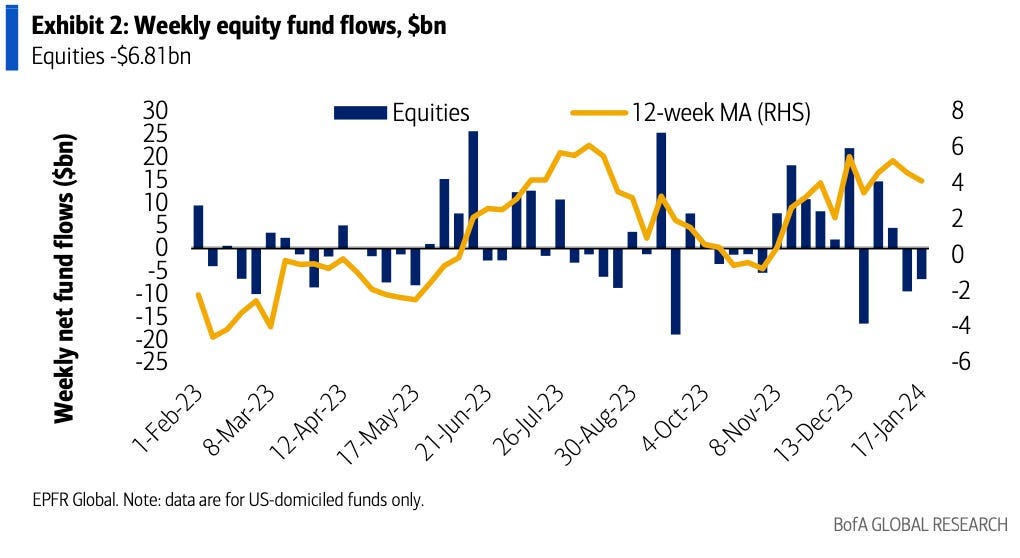
As usual, retail investors are going the wrong way. Equity funds saw outflows of $6.81 billion last week after a $9.5 billion outflow the week before.
h/t @dailychartbook
Is The Recession Canceled?
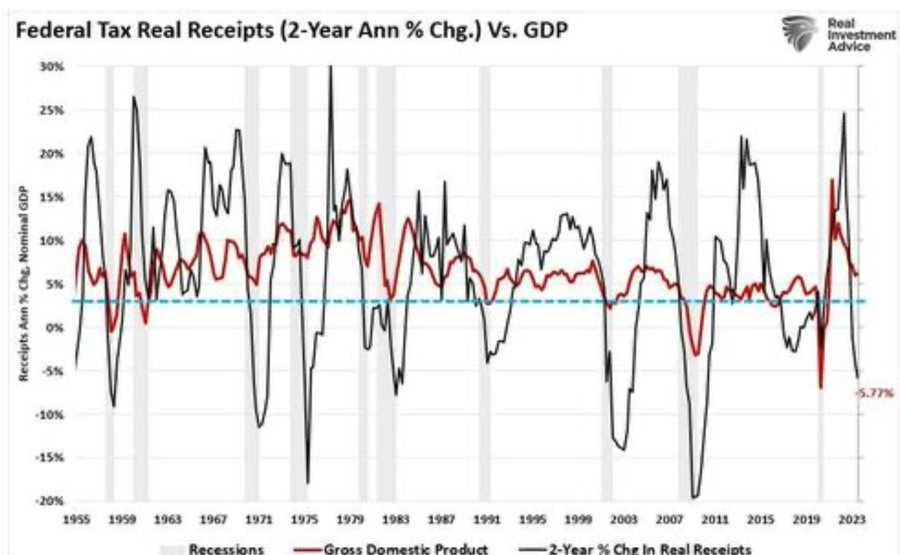
Even though Wall Street doesn't believe it yet, a recession is coming. The mother of all recession charts shows Federal tax receipts collapsing:
h/t @Stimpyz1
Another recession indicator that has a near-perfect track record over the last 75 years is the ISM Manufacturing New Orders Index. It is a sub-component of the well-known ISM Manufacturing Index (aka the Purchasing Managers' Index, or PMI). It was 47.1 in December, the16th consecutive month of a reading below 50 - contraction territory.

h/t Sean Williams
Since 1949, there have been a dozen instances where the ISM Manufacturing New Orders Index has fallen below a reading of 43.5. Only one of these instances, which occurred early in 1952, did not lead to a recession. Every other instance over the past 72 years where the ISM Manufacturing New Orders Index has dipped below 43.5 has been followed by a recession. During the last 16 months, this Index has dipped below 43.5 twice.
In addition, the November Fed Beige Book showed two-thirds of the 12 Federal Reserve districts are either contracting or stagnating. That’s more downbeat than any previous Beige Book on the cusp of past recessions.
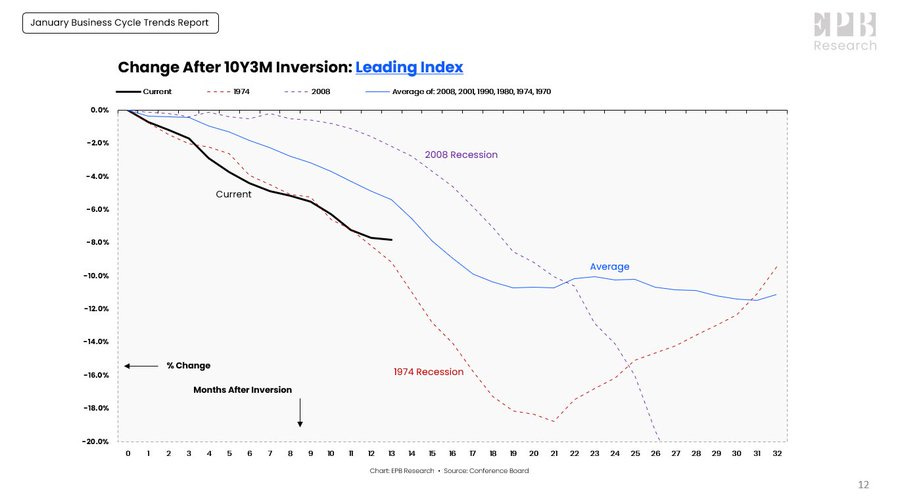
And the Conference Board Leading Economic Index has declined 7.8% since the three-month/10-year Treasury curve inverted 13 months ago. This 7.8% decline is worse than the average 5.4% decline by the 13thmonth after an inversion. The worst performance by Month 13 was the 1974 recession, where the LEI was down 9.2%.
h/t @EPBResearch
Although a recession will cause more stock market volatility as Wall Street tries to scare people out of holding stocks, I still recommend being fully invested. “Fully invested” for some traders may mean holding some dry powder to pick up bargains in the periodic downturns, while for others it means being on margin. For me, it just means 100% invested.
I still think the recession will be mild and short, even though I don't think the Fed will be in any hurry to cut interest rates. But I do recognize that downturns can spiral out of control – as does Chairman Powell – so I'll be watching for signs it's getting worse than I expect.
Market Outlook
The S&P 500 added another 3.3% since last Thursday with five straight record closes, including the first pair of consecutive record closes since December 2021. After a pair of consecutive records, since 1950 the Index has historically averaged a gain of 3.9% in the following six months. The median gain has been 5.1%. The S&P is up 2.6% year-to-date.
The quarterly path of S&P 500 earnings growth for 2024 will support further gains:
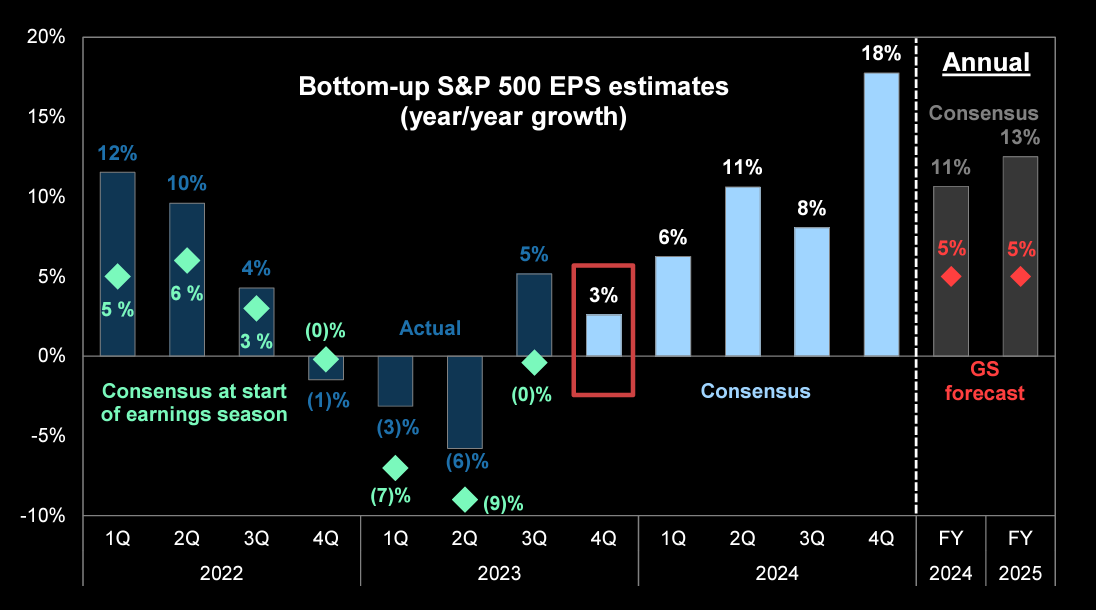
h/t @themarketear
The Nasdaq Composite gained 3.0% and is up 3.3% for the year. The SPDR S&P Biotech Exchange-Traded Fund (XBI) climbed 1.7% but is down 0.9% year-to-date as the biotech rally stalls.
The small-cap Russell 2000 added 2.6% but is down 2.6% in 2024. Even though the Russel Index is down, there's a wide spread of individual performance. Some sectors like biotech are weak but we're seeing the most small-caps making new highs in years.
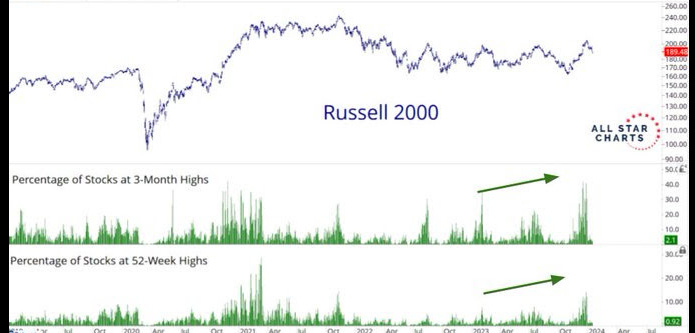
h/t @allstarcharts
Risk aversion is back among the pros, and the recent spike in the National Association of Active Investment Managers Exposure Index quickly returned to normal territory in response to the All-Time Highs. The pain trade still is to the upside.
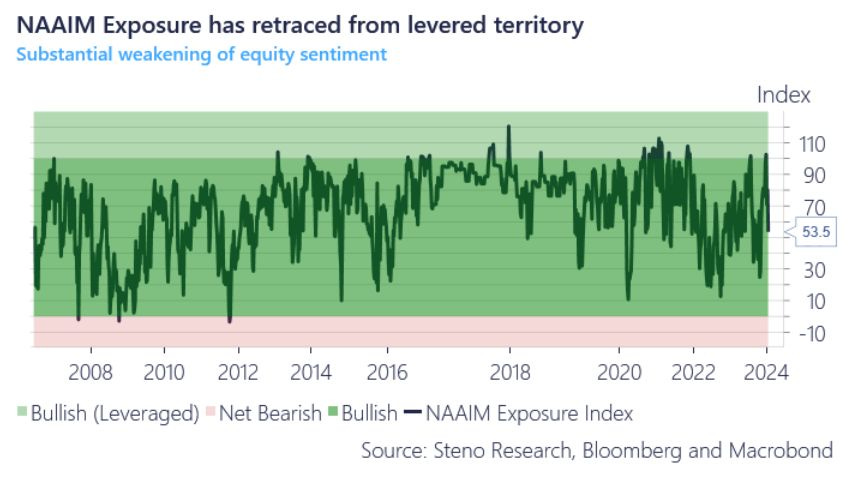
h/t @AndreasSteno
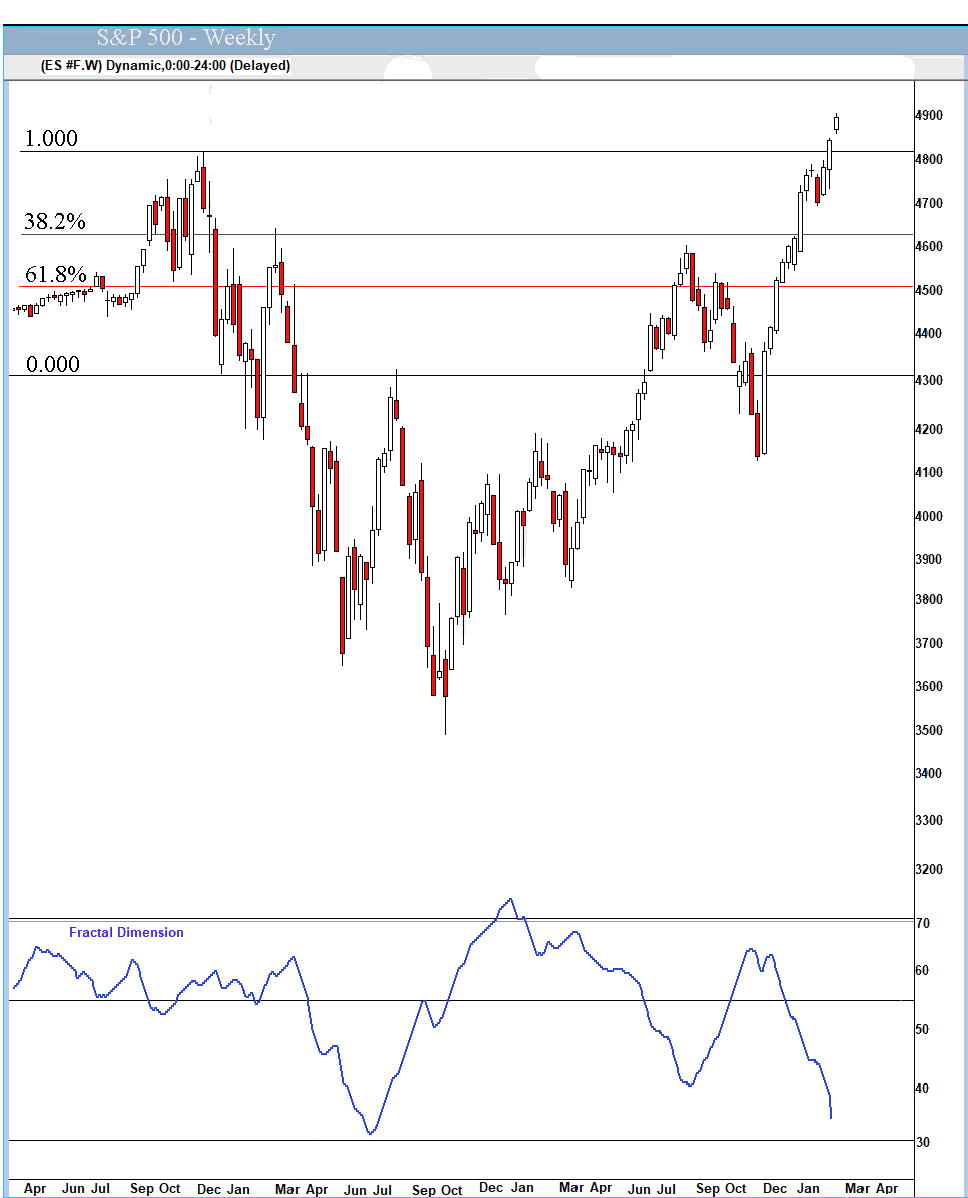
The fractal dimension says the end of this upturn is in sight – maybe next week. Remember that consolidations can be by price – a quick, scary plunge would do it – or time, as in going more or less sideways for a couple of months.
Coming Events
All times below are ET
Wednesday, January 31
Fed Meeting - 2:00pm press release; 2:30pm conference
Friday, February 2
January payrolls - 8:30am - +178,000 expected; December was +216,000
Golden Age Portfolio Update
This was a meh week for the portfolio as backed off 0.3% from last week's all -time high. We're now up 1.9% this year with much more to come. Let's dig in...
* * * * * * * * * * * * * * * * * * * * * * * * * * * * * * * * * * * * * * * * * * * * * * * * * * * * * * * * * * * * *
The Good Mourning Show
* * * * * * * * * * * * * * * * * * * * * * * * * * * * * * * * * * * * * * * * * * * * * * * * * * * * * * * * * * * * *

* * * * * * * * * * * * * * * * * * * * * * * * * * * * * * * * * * * * * * * * * * * * * * * * * * * * * * * * * * * *
Your trying to get the truth on Ukraine Editor,

Paid subscriber or not, if you would click the ♥ symbol below it would really help me get the word out.