


12/18 – 12/22 Red Rock Update
12/18 – 12/22 Red Rock Update
Building Wealth in the Secular Bull Market to 2036
Stocks peak about every 36 years, most recently in 1929, 1965, and 2000. This 36-year cycle can be traced all the way back to the earliest eras in recorded human history, back to Pythagoras and Plato and the Axial Age around 600BC. After each peak comes a period of decline (punctuated by bear market rallies) that typically lasts 16 years or so. Then, with the excesses of the prior bull period wrung out and investors most depressed, the next 20-year run to the next market top can begin.
Howdy, Bull-Riders:
Due to the lack of news, the holidays, and a daughter home from college for an all-too-brief visit, I'm going to do a holiday skip of next week's issue and be back on January 5 for an even better 2024.
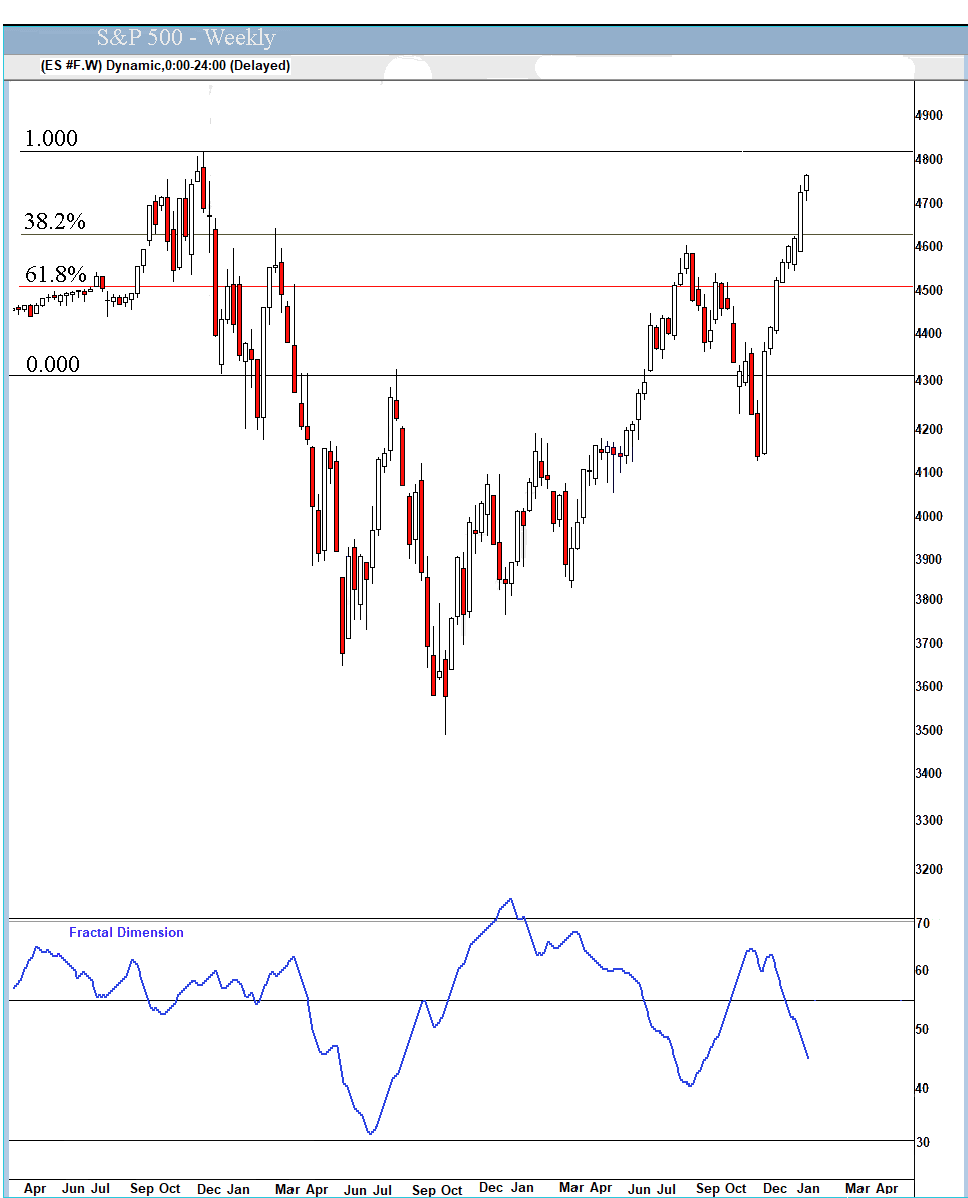
Today, the markets extended what is now the longest string of weekly gains since 2017. This has been one of the biggest Christmas rallies in history. On January 3, 2022, the S&P 500 hit a record high closing level of 4796.56, just 42 points away from today's close. We could see a new record before the end of 2023. I think we'll go over 5000 in 2024, but probably not much over.
The fourth year of the Presidential cycle usually is marked by high-level churning as the third-year gains are locked in and the usual political acrimony plays out. Bulls will point to the transition from interest rate increases to cuts, arguing that This Stock Market Indicator Has Been 83% Accurate Since 1984. It's Signaling a Big Move in the S&P 500 Right Now. Bears also will point to the transition from interest rate increases to cuts, arguing that This Indicator Has Predicted Every Bear Market for 40 Years and Could Hint Where the S&P 500 Goes in 2024. Both of those articles were published yesterday by Motley Fool!
This rally has been driven by retail investors. Last Friday, after the Fed pivot, the biggest S&P 500 exchange-traded fund, the SPDR S&P 500 ETF Trust (SPY), had its biggest single-day inflow since its inception in 1993 - $20.8 billion. Total inflows last week alone hit $24 billion, also posting a new record. Monday, SPY saw ANOTHER $10 billion of inflows, putting the total at nearly $35 billion since Friday, December 8. That's $35 billion in 6 trading days, or $5.8 billion PER DAY. Santa Claus Rally is an understatement.

h/t @KobeissiLetter
Of course, that means retail investors already are all-in...something the contrarian in me does not want to see. The CNN Fear & Greed Index hit Extreme Greed again.
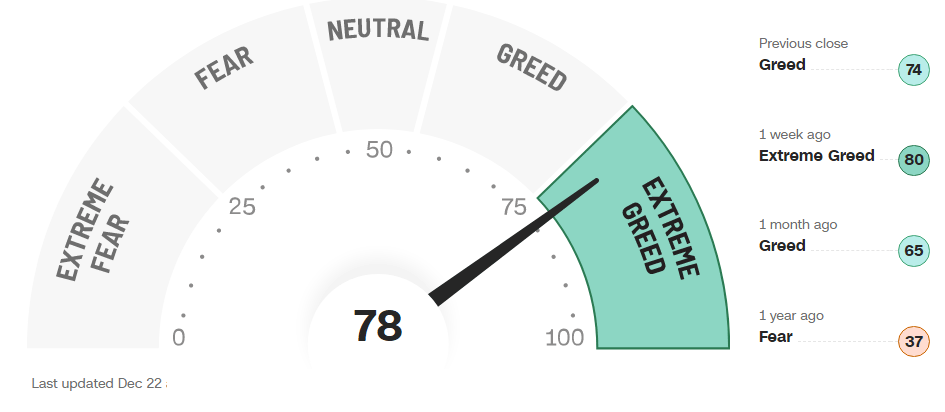
h/t CNN
And the American Association of Individual Investors sentiment survey shows the ratio of bulls to bears has risen to levels associated with stock market reversals.
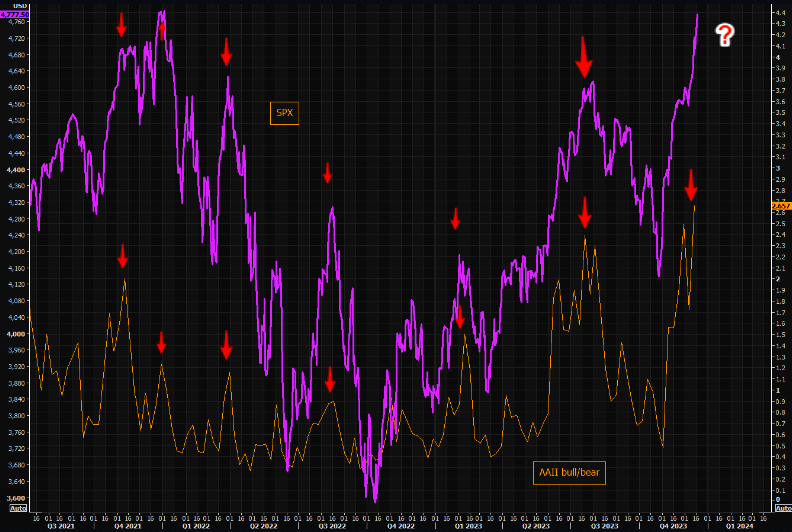
h/t @themarketear
So, who's left to buy? Well, as it turns out, the hedge funds have been way too bearish and the least net-long since 2011. Perhaps they were listening to legendary investor Jeremy Grantham last January 24:

This is the worst month for long/short hedge funds since January 2021 and the second worst month in 12 years. The Commodity Trading Advisers were too bearish at the start of November, when the S&P was at five-month lows and the prevailing mood in the Wall Street momentum-chasing echo chamber was apocalyptic, and they've been scrambling to get long. The institutions are making their annual pension and 401-K contributions over the next couple of weeks, and a chunk of that goes straight into S&P index funds.
Right now, there is $5 trillion in short-term cash in rolling US Treasury bills that can extend in duration and take more risk. It is very hard to predict when, because it’s animal spirits, and predicting animal spirits is not an easy game. But the moment this happens, you will see a tidal wave of money into longer-duration fixed income, mortgages, munis, and stocks. Added together, there is $7 to $10 trillion in potential buying power to kick off the new year.
The S&P 500 bounced back yesterday from its worst day since September to add 0.6% since last Thursday and closed today less than 1% under the all-time closing high. It has risen 4.1% this month and is up 23.8% year-to-date. The Index recorded an eight-week winning streak today. It was the 20th time that happened since 1950 and the first since November 2017. Following all prior eight-week winning streaks, in the following six weeks the Index closed higher the last 17 times in a row.

h/t @SJD10304
The Nasdaq Composite gained 1.4% after snapping a nine-day winning streak Wednesday and is up 43.0% for the year, on pace for its best year since 2020. The SPDR S&P Biotech Exchange-Traded Fund (XBI) slipped 1.3% as the new biotech bull market took a breather. It is up 2.0% year-to-date. The small-cap Russell 2000 added 1.6% and now is up 14.5% in 2023. The long/short ratio across the Russell has crashed to new lows, despite Russell's brutal squeeze. More pain for the shorts ahead!
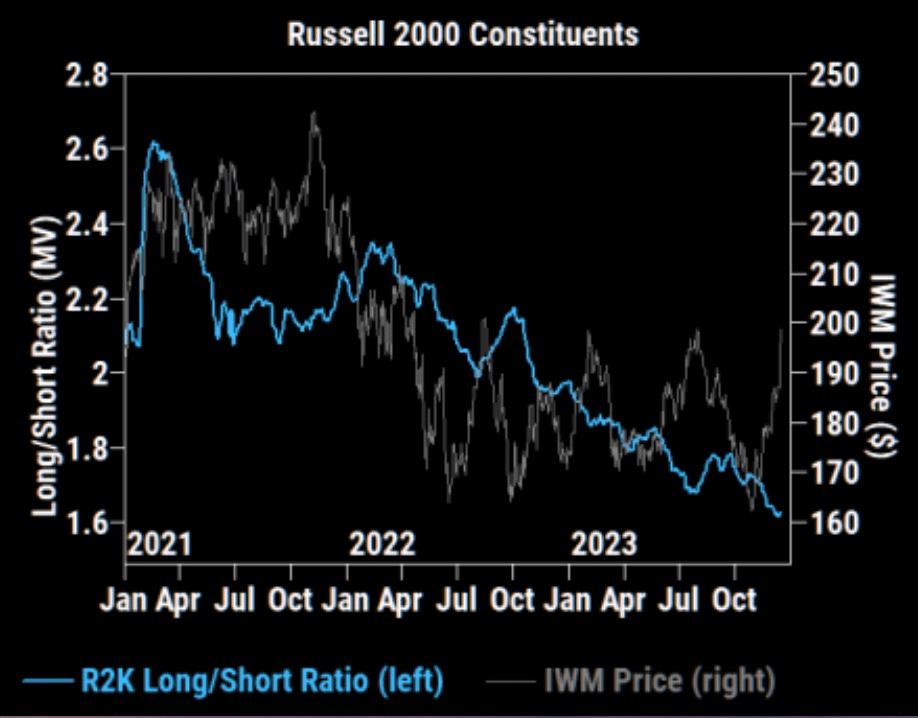
h/t @themarketear
The fractal dimension remains in full-on rally mode, with three to six weeks to go. The last rally did end with the fractals only in the low 40s – they never made it to 30. So we'll watch that.
Economy
The Atlanta Fed's GDPNow model is up to +2.7% thanks to an increase in expected private domestic investment growth. The Blue Chip economists still are too low and even headed in the wrong direction.

Precious Metals
Gold has a new solid support level at $2,000, and maybe at $2,020. The fractal dimension ticked below 55, marking a new trend underway. But a look back to mid-2021 shows a couple of times the fractals got to around 50 and then reversed direction – false signals. So while I'm willing to call this a real uptrend, I'd really like to see it extend enough to send the fractals decisively towards 30.

Golden Age Portfolio Update
This was yet another good week for the portfolio as it added another 2.0%. We're now up 64.0% with much more to come over the next few months. Let's dig in...